These tables and figures are part of the Phil Foster Ranches Insect Management System.
Tables
Figures
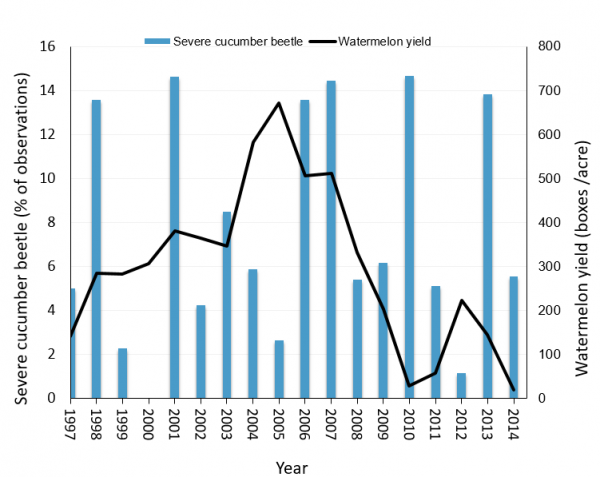
Figure 1. Severe cucumber beetle damage (percent of total observations) and watermelon yield (boxes/acre). From scouting and yield records, Phil Foster Ranches, 1997-2014.
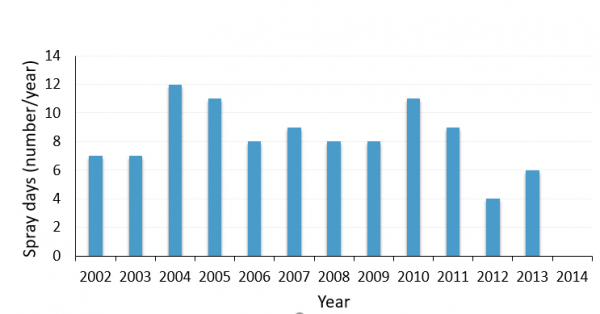
Figure 2. Number of spray days targeting cucumber beetle in watermelon. From scouting records, Phil Foster Ranches, 2002-2014.
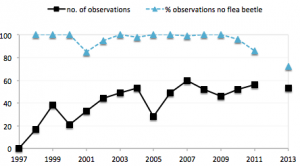
3A. Broccoli San Juan Rance, 3B. Cabbage San Juan Ranch.
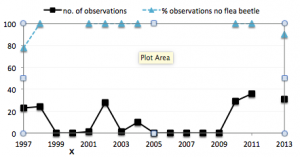
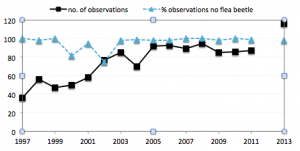
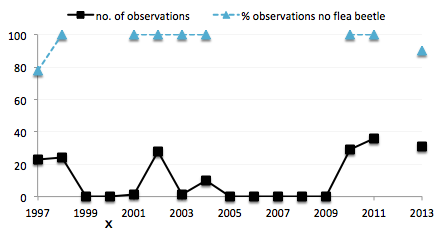
3C. Broccoli Santa Ana Ranch. 3D. Cabbage Santa Ana Ranch.
Figure 3A-3D. The total number of scouting observations for flea beetle on broccoli and cabbage and the percent of observations in which no flea beetle were observed. From San Juan (SJ) and Santa Ana (SA) scouting records, Phil Foster Ranches, 1997-2013.
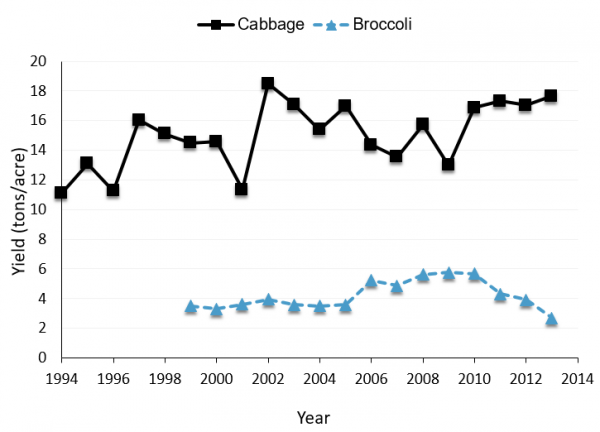
Figure 4. Broccoli and cabbage yields: Phil Foster Ranch. From yield data, Phil Foster Ranches, 1994-2013.
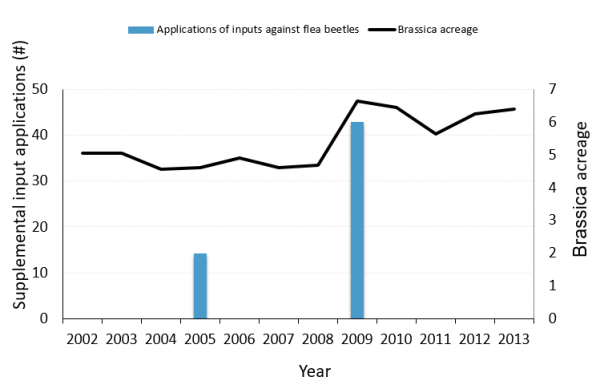
Figure 5. The number of applications of supplemental inputs with activity against flea beetles. From scouting records, Phil Foster Ranches, 2002-2013.
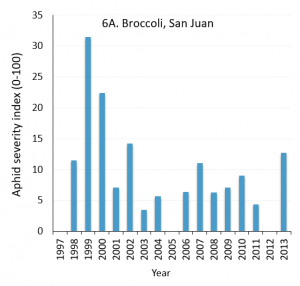
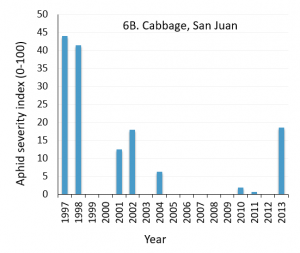
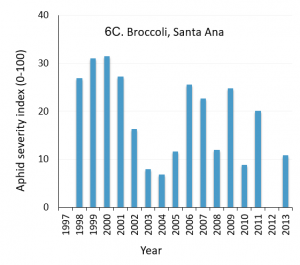
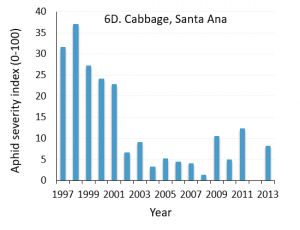
Figure 6A-6D. The aphid severity index for broccoli and cabbage at San Juan and Santa Ana ranches. The severity index was calculated as 100*(1w+2x+3y+4z)/4, where w represents the percent of all observations of very low aphid populations, x is the percent of all observations of low aphid populations, y is percent of observations of moderate aphid populations, and z is percent of high aphid populations. From scouting records, Phil Foster Ranches, 1997-2014.
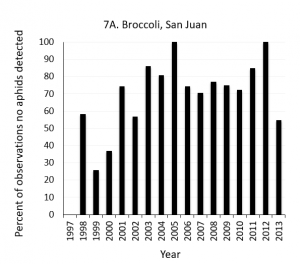
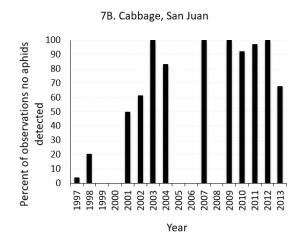
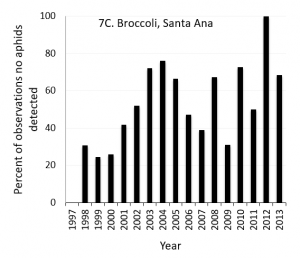
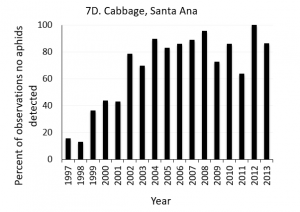
Figure 7A-7D. The percent of all scouting observations in which no aphids were present. From scouting records, Phil Foster Ranches, 1997-2014.
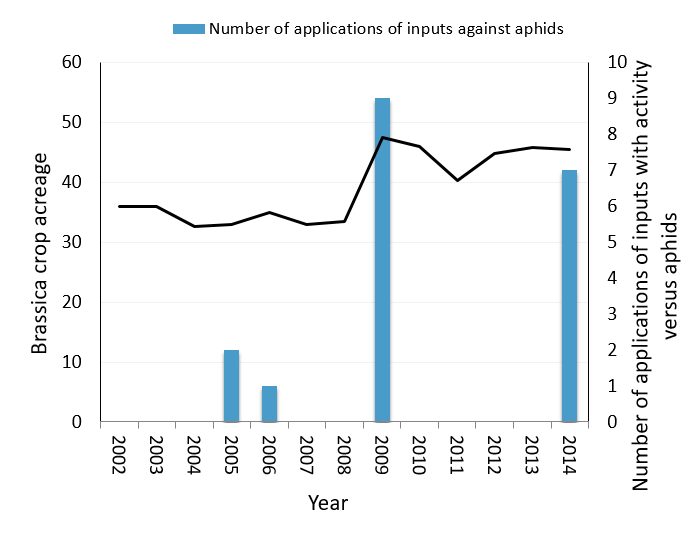
Figure 8A. Total brassica acreage and the number of applications of inputs with activity against aphids (PyGanic, M-Pede, Aza-Direct). From yield and inputs records, Phil Foster Ranches, 1997-2014.
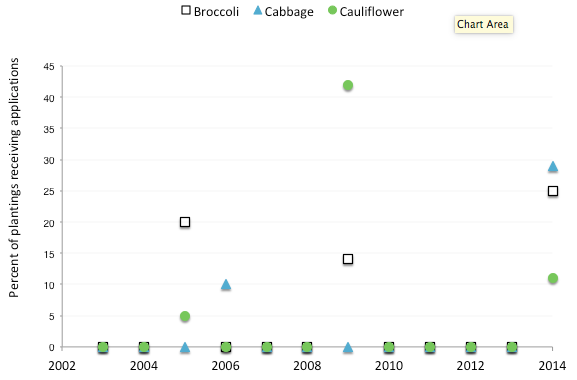
Figure 8B. Percent of plantings receiving one or more applications of inputs with activity against aphids (PyGanic, M-Pede, Aza-Direct). From yield and inputs records, Phil Foster Ranches, 1997-2014.
9A. Broccoli, San Jan. 9B. Cabbage, San Juan
9C. Broccoli, Santa Ana. 9D. Cabbage, Santa Ana.
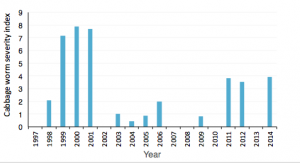
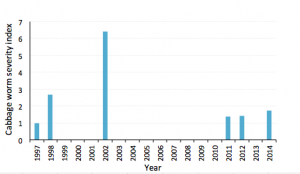
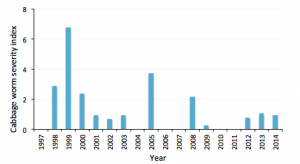
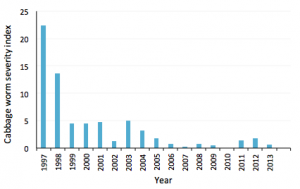
Figure 9A-9D. The cabbage worm severity index for broccoli and cabbage at San Juan and Santa Ana ranches. The severity index was calculated as 100*(1w+2x+3y+4z)/4, where w represents the percent of all observations of very low cabbage worm incidence/severity, x is the percent of all observations of low incidence/severity, y is percent of observations of moderate incidence/severity, and z is percent of high incidence/severity. From scouting records, Phil Foster Ranches, 1997-2014.
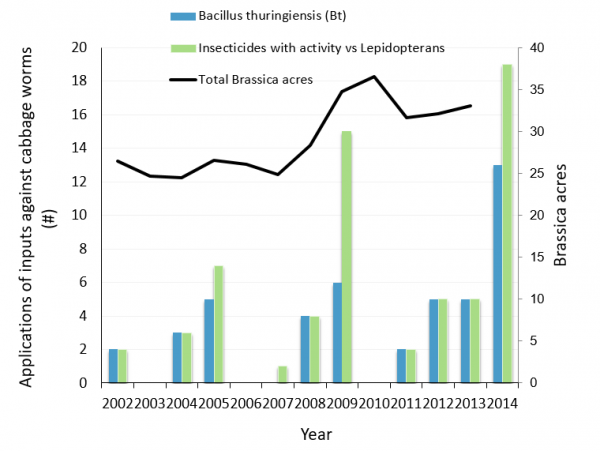
Figure 10. Fig. 10. Number of input applications with activity against cabbage worms and total brassica acres. From inputs and yield records, Phil Foster Ranches, 2002 - 2014.
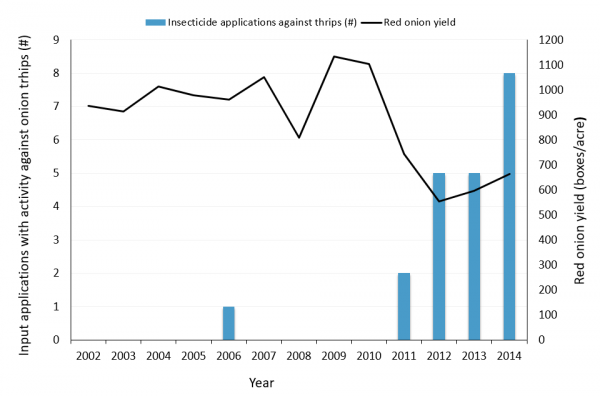
Figure 11. Number of input applications with activity against onion thrips and red onion yields. From inputs and yield records, Phil Foster Ranches, 2002 - 2014.