eOrganic author:
Michelle Wander, University of Illinois
This article reviews the basics for manure management in organic systems. Topics covered include National Organic Program regulations, the risk of contaminants in manures, guidelines on how to manage nutrients in manure, and testing manure or compost. Some of the challenges of nutrient supply and test interpretation associated with the repeated use of manures are discussed along with tips and tools you might use to determine manure application rates.
- Introduction, Rules, and Concerns
- Manure Handling: Raw Stacked or Composted
- Managing Nutrients in Manure
- References and Citations
- Additional Resources
Introduction, Rules, and Concerns
Livestock manure is a key fertilizer in organic and sustainable soil management. Manure provides plant nutrients and can be an excellent soil conditioner. Properly managed manure applications recycle nutrients to crops, improve soil quality, and protect water quality. It is most effectively used in combination with crop rotation, cover cropping, green manuring, liming, and the addition of other natural or biologically-friendly fertilizers and amendments.
Use of manure imported from conventional farming operations is allowed by National Organic Program (NOP) standards. There are, however, application restrictions. Manure may only be used in conjunction with other soil-building practices and be stored in a way that prevents contamination of surface or ground water. Many certifiers specify that manure application must not exceed “agronomic application rates”, which means the amount applied must be less than or equal to the requirements of the crop. Manure cannot be applied when the ground is frozen, snow-covered, or saturated.
The NOP regulation (§205.203(c)(1)) specifies that "raw" fresh, aerated, anaerobic, or "sheet composted" manures may only be applied on perennials or crops not for human consumption, or such uncomposted manures must be incorporated at least four months (120 days) before harvest of a crop for human consumption, if the crop contacts the soil or soil particles (especially important for nitrate accumulators, such as spinach). If the crop for human consumption does not contact the soil or soil particles (e.g. sweet corn), raw manure can be incorporated up to 90 days prior to harvest. Biosolids, sewage sludge, and other human wastes are prohibited. Septic wastes are prohibited, as well as anything containing human waste.
Composted plant and animal manures (§205.203(c)(2)) are those that are produced by a process that: (i) established an initial C:N ratio of between 25:1 and 40:1; and (ii) maintained a temperature of 131°F to 170°F for 3 days using an in-vessel or static aerated pile system; or (iii) a temperature of between 131°F and 170°F for 15 days using a windrow composting system, during which period, the materials must be turned a minimum of five times. Alternatively, acceptable composts must meet the November 9, 2006 NOSB Recommendation for Guidance Use of Compost, Vermicompost, Processed Manure and Compost Tea that identifies materials and practices that would be acceptable under 205.203(c)(2). For more information see Making and Using Composts in Organic Systems.
Processed manures are addressed in section §205.203(c)(3). Heat-treated, processed manure may be used as a supplement to a soil-building program, without a specific interval between application and harvest. Producers are expected to comply with all applicable requirements of the NOP regulation with respect to soil quality, including ensuring the soil is enhanced and maintained through proper stewardship.
According to the NOP's July 17, 2007 ruling, “processed manure products must be treated so that all portions of the product, without causing combustion, reach a minimum temperature of either 150°F (66°C) for at least one hour or 165°F (74°C), and are dried to a maximum moisture level of 12%; or an equivalent heating and drying process could be used." To achieve equivalency status, processed manure products can not contain more than 1x10³ (1,000) MPN (Most Probable Number) fecal coliform per gram of processed material sampled and not contain more than 3 MPN Salmonella per 4 gram sample of processed manure.
As always, organic vegetable growers should get label information and check with their certifiers before using purchased compost or processed manure products. See Can I Use This Input On My Organic Farm? for more information.
Some manures are contaminated with hormones, antibiotics, pesticides, disease organisms, heavy metals, and other undesirable substances. Many of the organic compounds, pathogens, protozoa, or viruses can be eliminated through high-temperature aerobic composting. Caution is advised, however, as some disease causing agents, e.g. Salmonella and E. coli bacteria, may survive the composting process. Manure and compost testing is available through commercial labs and is recomended in situations where there is any doubt about the purity of manures. Manure testing is required by the European Union and Canadian standards. The possibility of transmitting human diseases discourages the use of fresh manures and even some composts as pre-plant or sidedress fertilizers on vegetable crops. Apply animal manures at least 90 or 120 days, as applicable, prior to harvest of any crop that could be eaten without cooking.
Best management practices recommended for manure are as follows:
- Avoid manuring after planting a crop to be harvested.
- Incorporation before planting is recommended.
- Do not use dog or cat (fresh or composted) because these species share many parasites with humans.
- Wash all produce from manured fields thoroughly before use.
Cautions or concerns include the following:
- Manures imported from conventional farms can contain residues from hormones or pesticides. (For more information, see Antibiotics and Hormones in Animal Manure Webcast.)
- In rare cases, carryover of persistent herbicides can occur. Most herbicides break down rapidly after application or during normal composting. However, some of those in the pyridine carboxylic acid group such as clopyralid, which is commonly used on grass lawns, break down slowly, even during composting, and are not degraded when ingested by animals because they pass into the urine quickly. Application of manures or composts derived from grass treated with clopyralid is restricted during the “growing season of application” for all farms, not just those that are organic.
- Heavy metals (e.g., As, Cu, and Zn) are fed to livestock and then added to soils in the form of manures. Unlike sludge, metal content does not influence manure application rates to soils but should be considered as metals persist in the soil and will accumulate with repeat application. Concerns over heavy metals, other chemical contaminants, and salinity are most often raised in association with poultry litter. Under federal organic standards, certifiers may require testing of manure or compost if there is reason to suspect high levels of contamination.
- Weed seeds and plant diseases can be effectively controlled by high temperature aerobic composting of manures.
Manure Handling: Raw Stacked or Composted
The NOP regulation also requires that manure and other fertility inputs must be managed so that they do not contribute to contamination of crops, soil, or water by excess nutrients, pathogens, heavy metals, or residues of prohibited substances. Whether animals are raised on farm or manures are imported, organic farmers are likely to need to store manure on farm prior to application. Proper manure storage conserves nutrients and protects surface and groundwater. Storing manure can be as elaborate as keeping it under cover in a building, or as simple as covering the manure pile with a tarp. The important point is keeping the pile covered and away from drainage areas and standing water. The storage location should also be convenient to your animals and crop production.
When you are looking for organic forms of nutrients for crop production, manure and manure composts are two of the logical choices. Composting is more than just piling the material and letting it sit. Composting is the active management of manure and bedding to aid the decomposition of organic materials by microorganisms under controlled conditions. Weed and disease problems associated with raw manures can be alleviated with proper composting. Use of composted manures can also reduce P transport to waterbodies (Evanylo et al. 2008).
Organic producers making their own compost must keep records of their composting operation to demonstrate that the compost was produced according to the definition cited above. If the compost is purchased, the grower should ask for documentation from the supplier showing that the compost meets NOP requirements. Keep this documentation, along with purchase receipts, with your other records. If the compost is 100% plant-based, without any animal excrement or by-products, there is no requirement for heating or turning.
| Compost | Manure |
|---|---|
| slow release form of nutrients | usually higher nutrient content |
| easier to spread | sometimes difficult to spread |
| lower potential to degrade water quality | higher potential to degrade water quality |
| less likely to contain weed seeds | more likely to contain weed seeds |
| reduced pathogen levels (e.g. salmonella, E. coli) | potential for higher pathogen levels |
| higher investment of time or money | lower investment of time or money |
| more expensive to purchase | less expensive to purchase |
| fewer odors (although poor composting conditions create foul odors) | odors sometimes a problem |
| improves soil tilth | improves soil tilth |
Managing Nutrients in Manure
Manure nutrient contents are highly variable and growers must be able to understand and reduce this variability to make the best agronomic and environmental use of these resources. Manure must be carefully managed to prevent over- or under-application and to account for the cumulative environmental effects of application as well as storage. Balancing crop nutritional needs with manures is an ongoing challenge. Finding out about manure composition is critical to its efficient use. Applying too little can lead to inadequate crop growth because of lack of nutrients. Over-application can reduce crop quality and increase the risk of plant diseases. Over-application will also increases the risk of contaminating surface or groundwater.
There are three main sources of variability and uncertainty when using manure:
- Nutrient and moisture content of the manure.
- Material heterogeneity and application variability.
- Availability of nutrients to crops.
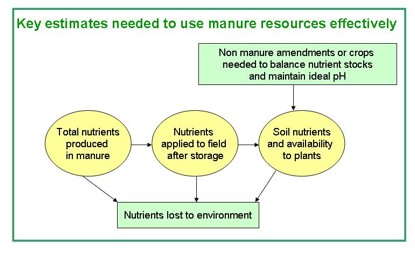
Figure 1. Nutrient flow from manure resources to storage facilities and then to field. Nutrients can be lost from all locations but only those arriving on the field have the chance to feed plants. Figure credit: Michelle Wander, University of Illinois.
Manure composition varies with the species of animal, feed, bedding, and manure storage practices. Table 1 shows typical published values for livestock manure. These values may not accurately represent your situation. Nutrient values can vary by a factor of two or more from the values listed in Table 2. This is why it is important to test materials applied instead of guessing.
| % Dry Matter | Ammonium–N | Organic–N | P2O5 | K2O | |
|---|---|---|---|---|---|
| Slurry Manure | (lb. of nutrient per 1,000 gallons of manure) | ||||
| Dairy | 8 | 12 | 13 | 25 | 40 |
| Beef | 29 | 5 | 9 | 9 | 13 |
| Swine (finisher, wet-dry feeder) | 9 | 42 | 17 | 40 | 24 |
| Swine (slurry storage, dry feeder) | 6 | 28 | 11 | 34 | 24 |
| Swine (flush building) | 2 | 12 | 5 | 13 | 17 |
| Layer | 11 | 37 | 20 | 51 | 33 |
| Dairy (lagoon sludge)* | 10 | 4 | 17 | 20 | 16 |
| Swine (lagoon sludge) | 10 | 6 | 16 | 48 | 7 |
| Solid Manure | (lb. of nutrient per ton of manure) | ||||
| Beef (dirt lot) | 67 | 2 | 22 | 23 | 30 |
| Beef (paved lot)* | 29 | 5 | 9 | 9 | 13 |
| Swine (hood barns) | 57 | 4 | 13 | 20 | |
| Dairy (scraped earthen lots) | 46 | 3 | 14 | 11 | 16 |
| Broiler (litter from house) | 70 | 15 | 60 | 27 | 33 |
| Layer | 40 | 18 | 19 | 55 | 31 |
| Turkey (grower house litter) | 70 | 15 | 30 | ||
| Liquid Effluent from lagoon or holding pond | (lbs. of nutrient per acre-inch) | ||||
| Beef (runoff holding pond) | 0.25 | 71 | 8 | 47 | 92 |
| Swine (lagoon) | 0.40 | 91 | 45 | 104 | 189 |
| Dairy (lagoon) | 2 | 317 | 362 | 674 | 1082 |
Value based upon ASAE, 2005, D384.2; Manure Production and Characteristics with exception of those marked with an "*".
Manure Sampling and Testing
Commercial laboratories can measure the nutrients in manure and save you from guessing based on table values. Testing laboratories typically charge from $30 to $60. It is important to use a laboratory that routinely tests animal manure, as they will know the correct type of analysis to use. Extension offices can provide you with publications that list manure testing laboratories in most regions; for example, see the Minnesota Department of Agriculture's listing of certified manure testing laboratories.
A nutrient analysis is only as good as the sample you take. The best time to sample by far is right before you apply the material because N loss in storage is accounted for. Also, if you use manure repeatedly from the same source, you can develop a running average analysis of that manure (over a 3+ year period). A running average is more likely to be accurate than a single sample taken from a storage pile or lagoon. Samples must be fresh and representative of the manure. Follow these steps:
- Ask the laboratory what type of containers they prefer and make sure the laboratory knows when your sample is coming. Laboratories should receive samples within 48 hours of collection. Plan to collect and send your sample early in the week so the sample does not arrive at the lab on a Friday or a weekend.
- If you have a bucket loader and a large amount of manure, use the loader to mix the manure before sampling.
- Take 10–20 small samples from different parts and depths of the manure pile to form a composite sample. The composite sample should be about 5 gallons. The more heterogeneous your pile, the more samples you should take.
- With a shovel or your hands thoroughly mix the composite sample. You may need to use your hands to ensure complete mixing. Wear rubber gloves when mixing manure samples with your hands.
- Collect about one quart of manure from the composite sample and place in an appropriate container.
- Freeze the sample if you are mailing it. Use rapid delivery to ensure that it arrives at the laboratory within 24–48 hours. You can refrigerate the sample if you are delivering it directly to the lab.
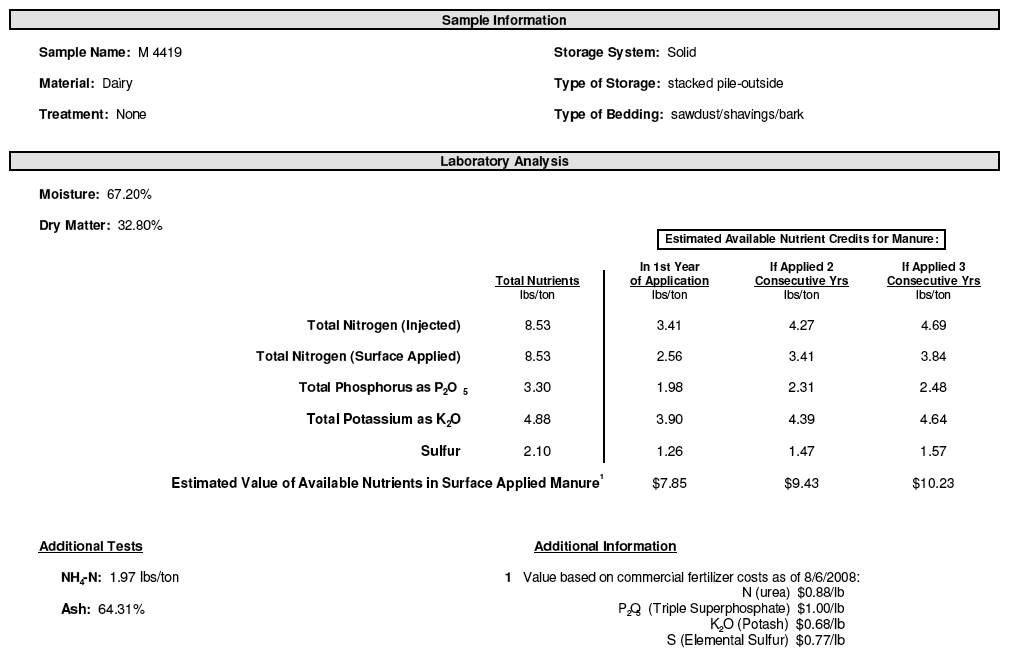
Figure 2. Example of a manure analysis report. Note, the report includes "additional information" about the relative value of nutrients which is subject to change. By convention, available nutrient contents are expressed in terms of reference materials used in fertilizer labels.
Laboratories report results on an as-received or a dry weight basis. As-received results usually are reported in units of lb/ton, while dry weight results usually are reported in percent, ppm, or mg/kg. The “as-received” results, as shown above, are easily used to determining application rates. Dry-weight results can be used to compare analyses over time and from different manure sources.
To convert manure analyses reported on a dry-weight basis (in percent) to an as-received basis (in lb/wet ton), multiply by 20 to convert the dry weight percent to lb/ton; then multiply by the decimal equivalent (23%/100) of the solids content.
Example: For beef manure at 23% solids and 2.4% nitrogen (N) on a dry weight basis:
Step 1. 2.4% x 20 = 48 lb N/ton dry weight
Step 2. 48 lb N/ton dry weight x 0.23 = 11 lb N/ton as-is.
Analyses typically include total nitrogen, ammonium nitrogen (NH4+–N), total phosphorus, total potassium, electrical conductivity, and solids (dry matter). If the manure is old or has been composted you may also want to test for nitrate–N. Total carbon (C) and pH are also useful measurements. Total C can be used to determine the C:N ratio and predict whether or not manure addition is likely to cause nitrogen immobilization. Manure with a C:N ratio greater than 25 is likely to 'tie up' or immobilize nitrogen when you apply it to the soil and stimulate a flush of growth by bacteria and fungi. Bedded manures typically have higher C:N ratios.
Manure Application Rates
When application rates of manure are based on providing adequate nitrogen for crop growth, added phosphorus and potassium levels will often exceed crop need, so manure should not ve the sole N source in an organic system. Excess levels of soil P can increase the amount of P in runoff, increasing the risk of surface water pollution. Many crops can handle high levels of K, but livestock can be harmed by nutrient imbalances if they consume a diet of forages with high K levels. Annual P-based manure or compost application is the most effective method of application when soil P buildup is a concern (Eghball and Power, 1999). Phosphorus-based application rates improve water quality, but reduce the amount of manure applied per area and so increase the land base needed for manure application. Where P buildup is a concern, legumes should be included in the rotation to provide additional nitrogen.
Typically manure is applied before the most N-demanding crop in the rotation and the amount of N likely to be plant available during the year of application is estimated. Nitrogen availability from manure varies greatly, depending on the type of animal, type and amount of bedding, and age and storage of manure (Table 3). Manure contains nitrogen in the organic and ammonium forms. The organic form releases N slowly, while ammonium–N is immediately available for crop growth.
| Manure type | Total N content (%) | % available N |
|---|---|---|
| Broiler litter | 4–6 | 40–70 |
| Laying hen | 4–6 | 40–70 |
| Sheep | 2.5–4 | 25–50 |
| Rabbit | 2.5–3.5 | 20–40 |
| Beef | 2–3 | 20–40 |
| Dry Stack | 1.2–2.5 | 20–40 |
| Separated Solids | 1–2 | 0–20 |
| Horse | 0.8–1.6 | 0–20 |
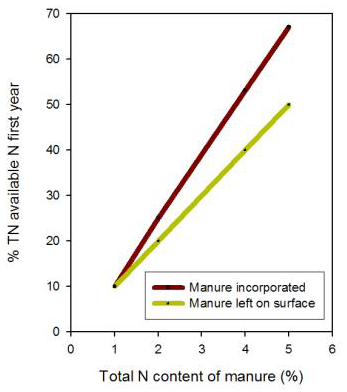
Figure 3. This graph can be used to predict N release based on total N content during the first year after manure application. Figure credit: adapted from Bary et al., 2000.
Solid manures contain most of their nitrogen in the organic form, but poultry manure contains substantial ammonium–N and so should not be surface applied to avoid loss of ammonia gas. Poultry and other manures that contain a large proportion of ammonium–N should be tilled into the soil the same day they are spread. Ammonia loss is greater in warm, dry, and breezy conditions where soil pH is high and is reduced in cool, wet weather. The N availability numbers in Table 2 are approximate ranges for each type of manure. Use the lower part of the ranges if ammonia losses are likely, the manure contains large amounts of bedding, or if the measured N content is lower than typical values. Use the upper range if the manure contains little bedding or if the measured N content is high. Expect first year N tie-up from manures containing less than 1% N. Horse manure or other manures with lots of woody bedding may temporarily tie up nitrogen rather than supply nitrogen for crop growth because the wood is still decaying and bacteria that break down the carbon in the wood consume nitrogen. Composting generally reduces the rate of release of manure N by as much as 50% by converting N into more biologically resistant forms.
Organic Fertilizer Calculators like the one linked here are extremely useful tools (Gale et al., 2006). Calculators and manure test information are a far better way to calculate application rates than using tables to estimate manure nutrient content and availability. See Additional Resources for more fertilizer calculators.
Monitoring Soil Nutrient Levels
Repeated applications of manure can increase the pool of slow-release nutrients and so the amount of manure needed to meet crop needs will decline over time. Farmers need to reduce the manure application rate for fields that receive repeated manure applications.
| Original Level | Application Rate (tons/acre/year) | ||||
|---|---|---|---|---|---|
| 0 | 10 | 20 | 30 | ||
| Soil organic matter (%) | 5.2 | 4.3 | 4.8 | 5.2 | 5.5 |
| CEC (meq/100g) | 17.8 | 15.8 | 17 | 17.8 | 18.9 |
| pH | 6.4 | 6.0 | 6.2 | 6.3 | 6.4 |
| P (ppm) | 4 | 6.0 | 7.0 | 14 | 17 |
| K (ppm) | 129 | 121 | 159 | 191 | 232 |
| Total Pore Space (%) | n.d. | 44 | 45 | 47 | 50 |
Table 4 shows trends where repeat application of manure to a clay soil at three rates has influenced soil properties. Organic matter levels were only maintained where rates equaled 20 tons or more. At these rates P and K levels were in excess. To avoid manure-induced imbalances, continually monitor soil fertility, using appropriate soil tests. Use cover crops and lime or other supplementary fertilizers and amendments to ensure soil balance or restrict application levels if needed.
You can use basic soil tests to evaluate the soil for sufficiency or excess of other nutrients. A basic soil test includes P, K, calcium (Ca), magnesium (Mg), boron (B), pH, EC, and a lime recommendation. If you have consistently low levels of P and K and reduced crop growth, you can probably increase your manure application rates. If you have excessive levels of P and K, you should decrease or eliminate manure applications.
Soil tests can be timed to evaluate different aspects of nutrient supply. Testing the year after manures are applied to assess increased P and K supply is recommended (Heming, 2008). Table 5 shows how test levels rise for several years due to the slow release nature of P contained in many manures.
| Fertilizer equivalent P per tonne | |||||
|---|---|---|---|---|---|
| Years after application | n | Median | Mean | P | |
| Cattle FYM | 1 | 39 | 0.48 | 0.62 | |
| 2 | 55 | 0.75 | 1.21 | 0.006 | |
| 3 | 23 | 1.1 | 1.82 | 0.018 | |
| 4+ | 8 | 2.2 | 2.61 | 0.12 | |
| Pig manure | 1 | 11 | 0.44 | 0.56 | |
| 2 | 11 | 0.93 | 0.89 | 0.04 | |
| Poultry manure | 1 | 5 | 1.21 | 2.44 | |
| 2, 3 | 7 | 5.23 | 5.89 | 0.04 | |
| Cattle slurry | 1 | 2 | -0.37 | -0.37 | |
| 2, 3 | 5 | 1.63 | 2.92 | 0.05 | |
| Pig slurry | 1 | 3 | 0.82 | 0.87 | |
| 2 | 6 | 0.97 | 1.24 | 0.46 | |
| 3 | 3 | 1.53 | 1.13 | -0.84 | |
P-values are for the mean FEP being the same as at Ct - 1; italics if P < 0.05. Standard errors for each mean are about 0.5 kg/t for FYM and raw cake, 0.2 for pig manure. The local digested cakes contained about 5 kg total P per tonne and raw cake 2.5 kg total P per tonne.
Late season sampling (0–12 inches or more) can be used to determine whether there is surplus nitrate-N remaining in the soil in the fall. If you apply too much manure, unused nitrate N will accumulate. When the fall and winter rains come, the nitrate will leach from the soil and become a potential contaminant in groundwater or surface water. Excess N can also harm some crops, delaying fruiting and increasing the risk of disease damage, freeze damage, and wind damage. Take a "report card" sample as you would any other soil sample, collecting soil cores at multiple spots in the field, and combining the cores together into a composite sample. If late season nitrate–N results are greater than 15–20 mg/kg, you are supplying more N than your crop needs and should reduce or avoid manure application. Report-card nitrate-N levels greater than 30 mg/kg are excessive.
Nutrient requirements for specific crops can be found in Cooperative Extension production guides or from soil test recommendations. Crop performance can be used to help fine tune application rates.
References and Citations
- Agricultural Marketing Service—National Organic Program [Online]. United States Department of Agriculture. Available at: http://www.ams.usda.gov/nop/ (verified 10 March 2010).
- Bary, A., C. Cogger, and D. Sullivan. 2000. Fertilizing with manure. PNW0533. Pacific Northwest Extension Publications, Washington State University, Pullman. (Available online at: http://pubs.cahnrs.wsu.edu/publications/pubs/pnw533/)) (verified 3 Sep 2019).
- Evanylo, G., C. Sherony, J. Spargo, D. Starner, M. Brosius, and K. Haering. 2008. Soil and water environmental effects of fertilizer-, manure-, and compost-based fertility practices in an organic vegetable cropping system. Agriculture, Ecosystems & Environment 127: 50–58. doi:10.1016/j.agee.2008.02.014
- Gale, E. S., D. M. Sullivan, C. G. Cogger, A. I. Bary, D. D. Hemphill, and E. A. Myhre. 2006. Estimating plant-available nitrogen release from manures, composts, and specialty products. Journal of Environmental Quality. 35: 2321–2332.
- Heming, S. D. 2008. The fertilizer equivalent of phosphorus and potassium in organic manures applied to arable soils. Soil Use and Management 24: 318–322. doi:10.2134/jeq2006.0062
- Koelsch, R., and C. Shapiro. 2006. Determining crop available nutrients from manure. NebGuide G1335. University of Nebraska Extension, Lincoln. (Available online at: http://efotg.sc.egov.usda.gov/references/public/NE/G1335_Determining_Cro...) (verified 12 March 2014).
- Kuepper, G., 2003. Manures for organic crop production [Online]. ATTRA Publication #IP127. National Sustainable Agriculture Information Service. Available at: https://attra.ncat.org/product/manures-for-organic-crop-production/ (verified 14 June 2019).
- Magdoff, F., and H. Van Es. 2009. Building soils for better crops. 3rd ed. Sustainable Agriculture Network Handbook Series Book 10. National Agricultural Laboratory, Beltsville, MD. (Available online at: http://www.sare.org/publications/bsbc/bsbc.pdf) (verified 10 March 2010).
- United States Department of Agriculture. 2000. National organic program: Final rule. Codified at 7 C.F.R., part 205. (Available online at: http://www.ecfr.gov/cgi-bin/text-idx?SID=a6a0935ddf00e166695f4c2138bd58d...) (verified 10 March 2010).
Additional Resources
- Andrews, N. and J. Foster. 2007. Organic Fertilizer Calculator: A tool for comparing the cost, nutrient value, and nitrogen availability of organic materials. EM 8936-E. Oregon State University Extension Service, Corvallis. (Available online at: https://extension.oregonstate.edu/organic-fertilizer-cover-crop-calculators) (verified 8 Nov 2019).
- Certified Manure Testing Laboratories [Online]. Minnesota Department of Agriculture. Available at: http://www2.mda.state.mn.us/webapp/lis/manurelabs.jsp (verified 10 March 2010).
- Manure Nutrient Availability Calculator [Online]. Manure Management Planner. Purdue Research Foundation, West Lafayette, IN. Available at: https://www.agry.purdue.edu/mmp/webcalc/help/nutAvail.html (verified 8 Nov 2019).
- Manure Plant Available Nitrogen (PAN) Calculation [Online]. Resources for Nutrient Management Planners. University of Missouri Extension, Columbia. Available at: http://nmplanner.missouri.edu/tools/pan_calculator.asp (verified 10 March 2010).
- Seal of Testing Assurance [Online]. U.S. Composting Council. Available at: https://www.compostingcouncil.org/page/CertifiedLabs (verified 8 Nov 2019).
- Sullivan, D. M. 2008. Estimating plant-available nitrogen from manure [Online]. EM 8954-E. Oregon State University Extension, Corvallis. Available at: http://ir.library.oregonstate.edu/xmlui/bitstream/handle/1957/20528/em89... (verified 12 March 2014).