eOrganic authors:
Aaron Heinrich, Oregon State University
Jeff Falen, Persephone Farm
Alex Stone, Oregon State University
A trend observed on many organic vegetable farms that rely on imported manures and manure-based composts and fertilizers is an increase in soil test phosphorus (P) and potassium (K) levels above sufficiency (the level at which additional nutrient input is unlikely to increase yield or product quality). High soil test P levels are not detrimental to crops, but they do increase the possibility of off-farm P movement, primarily through sediment loss in runoff. Phosphorus that enters waterways may contribute to an increase in algal growth (eutrophication), which can ultimately result in death of aquatic organisms. High soil test K levels are not harmful to the environment, but can reduce plant calcium (Ca) and magnesium (Mg) uptake. If forage grown on high soil test K soils is fed to ruminant livestock (beef and dairy cattle and sheep), there is an increased risk of magnesium deficiency, which can result in the metabolic disease called grass tetany. A challenge for organic vegetable farmers over the long term is to develop a nutrient and soil management plan that does not generate high soil P and K levels.
Increasing soil organic matter (SOM) levels is often the primary goal of most organic farms' nutrient management programs because it is the reservoir that supplies nutrients to plants and soil organisms. To build or maintain SOM in intensively tilled vegetable production systems requires inputs of organic materials such as composts, manures, fertilizers, crop residues, and cover crops. The rate at which most organic fertilizers are applied is often based on crop nitrogen (N) requirements because N is typically the most limiting nutrient during most growing seasons, and yearly applications are often required. Many farms also routinely apply compost as a soil amendment, but not necessarily at agronomic rates (rates based on the nutrient requirement of the crop).
Although most organically managed systems primarily need only N, most organic fertilizers and amendments contain other nutrients. For example, chicken manure has a typical analysis of 4-3-3 (N-P2O5-K2O). Because plants require significantly more N than P, and often more N than K, adding a fertilizer such as chicken manure to meet crop N requirements will typically result in P and K applications in excess of crop needs. Over time, addition of P and K in off-farm composts and manures at rates that exceed crop removal will result in increasing soil test P and K levels. This happens because P and K are relatively immobile in most soils (i.e., will not be washed out of the root zone with irrigation or winter rains) and will build up over time.
Persephone Farm, an organic vegetable and poultry farm located in western Oregon, is used here as a case study to explore the relationship between the farm's nutrient management program and increasing soil test P and K levels. This farm was chosen because they have almost 30 years of rotation, nutrient management, and soil analysis data available, and their primary fertilizer source since they started farming has been off-farm chicken manure. Persephone is a diversified vegetable farm; however, in 2000 they integrated pastured laying chickens into their vegetable system.
The goal of this article is to explore the reasons for the increases in soil test P and K levels and to describe strategies for preventing further increases.
Farm Description
Persephone Farm has been certified as organic since 1985. In the 1970's and 1980's, the previous owners grew grains and peppermint on the land. Prior to that, the land was sheep pasture. Persephone Farm grows diversified vegetables on 21 acres. Their produce is sold at farmers markets and to restaurants and distributors. The soil on most of the acreage is a well-drained, deep, alluvial clay loam. The initial soil organic matter content averaged 2.8% across all fields during the first 5 years of organic management, but has since increased to an average of 5.2%. This increase is the result of annual additions of organic matter from cover crops, rotation into pasture, and off-farm manure additions. The farm consists of five fields of approximately 4.5 acres each.
Persephone Farm adheres to a fairly strict four year rotation; vegetables are grown for three years, followed by one year in pasture. The pasture mix (red clover, ryegrass, and oats) is planted in the fall of the third year of vegetable production, and is taken out in the spring approximately 20 months later. If a late vegetable crop or early rains prevent pasture establishment, the field goes into cover crops in that year (typically Sudan grass). Ten to twenty-five percent of the acreage is in pasture at all times. Persephone also grows other summer and winter cover crops.
In 2000, Persephone added laying hens to their operation that are grazed year-round. The flock size fluctuates from 100 to 300 laying hens. The chickens are split into two flocks, each of which is pastured in a quarter-acre of fenced ground. These fenced areas are moved every 2-3 weeks through pasture, cover crops, and post-harvest fields, but they spend most of their time in pasture.
Nutrient Budgeting
Persephone Farm historically relied primarily on imported, minimally-processed or composted poultry litter for crop nutrient supply. However, due to food safety issues as well as availability, they now primarily use pelleted chicken manure (4-3-3) and feather meal (12-0-0). A yearly estimate of nutrients coming onto the farm from 2004–2010 in poultry manure and other specialty fertilizers is shown in Figure 1. The average rate of P2O5 and K2O applied to all fields over this time period was 55 and 67 lb/acre, respectively.
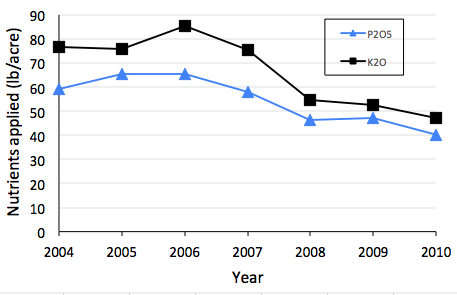
Fig. 1. Average annual fertilizer K2O and P2O5 applied (lb/acre) from 2004 to 2010 to Persephone's five fields.
A new source of off-farm nutrients entered the system when laying chickens were introduced in 2000. The chickens' foraging diet is supplemented with commercial laying rations, cracked corn, and a small amount of kelp meal. The farmers estimate that 30–50% (varies seasonally) of the chicken manure is collected in the laying house and not returned to farm fields (it is applied to a private garden). Some nutrients are exported in eggs and poultry carcasses. Estimated egg production is 3,000 dozen eggs per year. The chicken feed nutrient balance is given in Table 1.
Table 1. Annual nutrient balance from poultry operation
|
| P2O5 | K2O |
|---|---|---|
| Nutrient Inputs/Outputs | lb/acre/year5 | |
| Imported onto farm in feed1 | 11 | 7 |
| Exported in eggs2 | 1 | <1 |
| Exported in poultry carcasses3 | <1 | <1 |
| Manure removed from laying house (40%)4 | 4 | 3 |
| Retained in Fields | 6 | 4 |
1Laying ration (16,538 lb/yr; 3.35-0.55-0.70) + corn (1,875 lb/yr; 1.23-0.39-0.47)
23,000 dozen large eggs @ 228 mg P2O5 and 77 mg/K2O per egg
3Assuming 200 dry lbs of stewing chicken sold per year (8% N, 1%P, and 0.75% K; University of Delaware)
4A portion of this manure is collected and applied to a private garden (not returned to fields)
5This is averaged over 21 acres though only about 6 acres per year actually receive manure from the laying flock. Over time, these nutrients are evenly distributed over the farm.
Estimates of P and K removed in the harvested crops are given in Table 2. These estimates are based on realistic yield potentials for vegetables grown in Oregon, however, nutrient removal may vary greatly depending on variety, growth habit (i.e., bush peas vs. pole peas), extended harvest in greenhouses, disease pressure, etc. Average P2O5 and K2O uptake is estimated to be 27 and 113 lb/acre, respectively, though there is a wide range in uptake between crops.
Table 2. Estimates of P and K removal of select vegetable crops
| Crop | Yield | P2O5 | K2O |
| | ton/acre | lb/acre | |
| Broccoli1 | 8 | 20 | 110 |
| Cabbage1 | 30 | 55 | 230 |
| Carrots2 | 15 | 25 | 100 |
| Cauliflower1 | 6 | 20 | 60 |
| Cucumber, slicing2 | 10 | 10 | 40 |
| Lettuce, Romaine2,3 | 20 | 30 | 170 |
| Onion, bulb4 | 34 | 50 | 160 |
| Peas, shelled, bush2 | 2 | 10 | 20 |
| Peppers, bell2 | 20 | 30 | 110 |
| Potatoes2 | 20 | 60 | 250 |
| Snap beans, bush5 | 6 | 15 | 40 |
| Spinach6 | 12 | 15 | 120 |
| Squash, summer2 | 20 | 30 | 130 |
| Squash, winter2 | 18 | 20 | 120 |
| Sweet corn2 | 10 | 30 | 60 |
| Tomato2 | 12 | 10 | 80 |
| Average |
| 27 | 113 |
1Estimated using Oregon yields and nutrient removal based on Smith et al. (2014)
2Estimated using Oregon yields and nutrient removal based on Warncke at al. (2004)
3Sullivan et al. (2001)
4P data from Johnstone et al. (2005)
5Heinrich and Sullivan (2016)
6Heinrich et al. (2013)
Table 3 shows the nutrient balance of P and K entering the farm in fertilizer and chicken feed minus outputs in harvested vegetables and poultry products. Phosphorus entering the farm exceeded crop removal by 34 lb P2O5/acre/yr. For K, removals exceeded inputs by 44 lb K2O/yr. However, these data should be interpreted with caution because the actual crop mix and acreage and yields of each crop were not accounted for, and an average of crop removal was used (Table 2). Overall, the P and K contribution from the poultry operation is relatively minor, providing approximately 17% and 10% of the total P2O5 and K2O, respectively, of imports.
Table 3. Nutrient budgets for P and K
|
| | P2O5 | K2O |
| | | lb/acre/yr | |
| Inputs | From chicken feed (Table 1) | 11 | 7 |
| From fertilizer1 | 55 | 67 | |
| | subtotal | 66 | 74 |
| Outputs | Exported from poultry operation (Table 1) | 5 | 3 |
| Estimated crop removal in harvested product (Table 2) | 27 | 113 | |
| | subtotal | 32 | 116 |
| Remaining in field | 34 | -42 | |
1Average of all fields from 2004 to 2010
Soil P and K Trends
After almost three decades of annual off-farm nutrient applications, soil test P and K have increased to levels well above those needed to maintain optimum crop growth (Fig. 2). For most vegetable crops, the sufficiency level (the concentration at which a crop response to nutrient addition is highly unlikely) for P (Bray 1P method) and K (ammonium acetate method, equivalent to Mehlich III) is 75 and 250 ppm, respectively. Based on available soil test records, average initial soil test P and K levels in the late 80's and early 90's were already at or above sufficiency (Fig. 2). Since then, soil test P and K have more than doubled in most fields, and current levels are very high. Even though Persephone has been reducing P fertilizer inputs (Fig. 1), inputs still exceed outputs (Table 3). The decline in K since 2008 suggests that more K is being removed than imported, which is supported by the nutrient budget.
This case study highlights the value of soil testing at regular intervals, as well as good recordkeeping. For an individual field, there can be a high amount of variability between soil sampling dates (Fig. 2). This is due to inherent sampling variability, which may be affected by a number of factors including how it is collected, the number of subsamples, when it is collected (i.e., shortly after a fertilizer addition), etc. Due to this variability, multiple years of sampling at regular intervals is necessary for long term trends to appear. It is like the stock market—short term volatility does not necessarily indicate where the market is heading, but trends do emerge over the long term. Thirty years of soil testing reports combined with soil amendment records allowed us to identify trends.
The farmers estimate that their current nutrient application rates are 50% lower than the rates they applied when they first started farming. For example, in the early years (1988–1995) they applied 3 to 6 tons/acre chicken manure on cucumbers, but they now apply <2 tons/acre. Data from 2004 to 2010 show that off-farm K2O and P2O5 inputs have declined by 44% and 34%, respectively (Fig. 1). Despite reduced P inputs, P is still applied in excess of crop needs and soil test P is continuing to increase (Fig 2).
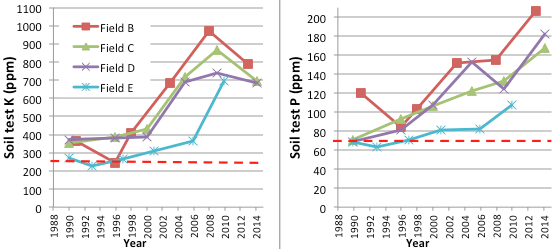
Figure 2. Soil nutrient trends for potassium (ammonium acetate method; left) and phosphorus (Bray 1P method; right) on select fields in the surface 8 inches. The dashed red line indicates the level that is considered to be sufficient for most crops. When soil test levels are higher than sufficiency, additional nutrient inputs are unlikely to increase yield or product quality.
Soil Processes Controlling Soil Test P and K Levels
In the first 5–10 years of farming, soil P and K levels remained relatively unchanged even though they were applying larger quantities of off-farm chicken manure than they do now (Fig.2). However, soil test P and K levels began rising rapidly in subsequent years (Fig.2). The buffering capacity of the soil may explain this change in rate. In this context, the buffering capacity is the ability of the soil to resist change in soil test P and K levels from applied fertilizer. In general, soils have a larger buffering capacity against change when soil test P and K values are low.
When the Persephone farmers started farming, it is likely that P was strongly adsorbed to Al and Fe oxide minerals, and K to the silicate clays. Once the adsorption sites were saturated, additional P and K was held less tightly, thereby increasing the test levels to a greater degree than additions when P and K contents were low and P and K were strongly adsorbed. For example, it likely takes less P to increase the soil test from 50 to 100 ppm than to increase from 20 to 50 ppm. Research conducted by McCollum (1991) on P decline following cessation of 30 years of annual P fertilizer additions supports this theory. He reported a logarithmic decline (i.e., initially very fast as the weakly adsorbed P was removed by crops, then much slower as the strongly adsorbed P was removed) in soil test P due to crop P removal. This may explain why soil test P and K levels continued to rise at the same time that the farmers reduced fertilizer applications over the last 10 yrs. Even though soil P and K levels were already high when they started farming, adsorption sites were likely not yet saturated.
Another contributing factor to increasing soil test K levels may be the increase in soil organic matter (SOM). Since they started farming, SOM at Persephone has increased by approximately 85%. Because SOM has a high cation exchange capacity (CEC), an increase in SOM content increases the soil's capacity to store cations such as K+. The laboratory test used to determine potential K availability measures the K+ cations adsorbed on clays and SOM. Assuming the ratio of exchangeable Ca, Mg, and K has remained constant, the 2.4% SOM increase (absolute increase) could theoretically increase soil test K level by 100 ppm (this assumes a CEC of OM=200 meq/100g and K comprising 5% of OM CEC).
In addition to the increase in SOM content, part of the increase in K may be due to the rotation into pasture. The plants in the pasture rotation, particularly legumes which are high in K, may be mining subsurface K and depositing it at the surface. Because the plants in the pasture are in the ground for a long period of time, they are able to form deeper, dense root systems capable of translocating subsurface soil K into the soil surface, potentially resulting in an accumulation of K in the plow layer.
Solutions
Increasing SOM is often the primary nutrient management goal of most organic farms. However, the use of off-farm inputs to meet this goal may be in conflict with a farm's environmental and sustainability objectives due to the increase in soil test P and K levels above those needed for optimum crop growth. To align a nutrient management program with farm values and production goals requires careful planning to either prevent elevated P and K levels from occurring, or to reduce current levels.
Prevention is the best solution. When first starting to farm a field organically, larger applications of compost and manures may be warranted to increase SOM, but only if initial P and K levels are below sufficiency (<75 and 250 ppm, respectively). Once sufficiency has been reached, an attempt should be made to balance imports of P and K with exports. It will be necessary to grow N–fixing cover crops, or to rotate into pasture to supply sufficient N to meet crop needs yet maintain or increase SOM without adding P or K.
If fields already have high soil test P and K, a list of practices that can be used to maintain or reduce levels are given in Table 4. Many years may be required to observe a measured decrease in soil test P using these practices, though on very high P soils the initial change may be more rapid (McCollum, 1991; Kratochvil, 2006).
Table 4. Practices for maintaining or reducing soil test P and K levels
| Practice | Benefits | Constraints |
| Grow a forage crop that will be sold to an off-farm animal operation | Removes P and K from system | If the ratio of K/(Ca+Mg) in the plant is >2.2 or in the soil is >0.06, this indicates a high potential for grass tetany if forage is fed to ruminants (Elliott, 2008) |
| Grow N-fixing winter cover crops (legumes) | Provides N to meet crop needs without increasing soil test P or K; typically the cheapest source of organic N relative to other organic fertilizers | Weather may not permit timely planting or spring incorporation; may not be compatible with early vegetable planting dates |
| Make compost from on-farm organic materials | Cycles nutrients on the farm without increasing P and K | Requires experience and equipment |
| Grow vegetables with high P and K removal in harvested product | Removes P and K from system | Opportunity cost of growing a potentially less profitable crop; lack of a market to sell product |
| Meet crop N demands with N-only fertilizers such as feather meal (13-0-0) or fertilizers with a high N analysis relative to P and K. | Supplies N without adding P and K in excess of crop needs | Cost - many of these specialty fertilizers are more expensive per pound of plant available N (PAN) compared to cover crop or manure PAN |
| Nutrient budgeting (match inputs with outputs) | Maintains soil test P and K | Time consuming when growing a diversity of crops; uncertainty in estimating crop uptake and removal |
Conclusions
Soil P and K levels on Persephone Farm have increased well above those needed for optimum crop growth. This is the result of almost three decades of off-farm chicken manure and fertilizer applications that exceeded nutrient removal in the harvested product. Due to the high P and K content of chicken manure relative to N (and the relatively limited soil mobility of P and K), these nutrients have accumulated in the soil resulting in elevated soil test P and K levels. Nutrient inputs from purchased chicken feed were less significant (17% and 10% of total P2O5 and K2O, respectively) than those from off-farm chicken manure.
The Persephone farmers estimate that their current nutrient application rates are 50% lower than when they first started farming. Soil testing indicates that this reduction may be responsible for declining soil test K levels. But even at current application rates, P is still being applied in excess of crop removal, and soil test P continues to increase. In response to elevated P and K, the farm now uses more feather meal to meet crop N needs. Although the farm would like to use more feather meal, they are limited by its cost and availability, and they also have concerns about the sustainability of feather meal as a nutrient source. Due to low crop P removal in harvested products relative to K, reducing P levels may take decades. Balancing nutrient inputs and outputs is necessary to create an environmentally sustainable nutrient management program.

This article was developed with support from USDA's National Institute of Food and Agriculture through the Western Sustainable Agriculture Research and Education program under grant number SW13-017.
References and Citations
- Elliott, M. G. 2008. Grass tetany in cattle—predicting its likelihood [Online]. Primefacts. NSW DPI, Primefact 785. Available at: http://www.dpi.nsw.gov.au/__data/assets/pdf_file/0006/226743/Grass-tetany-in-cattle-predicting-its-likelihood.pdf (verified 5 Jan 2017)
- Heinrich, A. L., R. Smith, and M. Cahn. 2013. Nutrient and water use of fresh market spinach. HortTechnology 23:325—333. Available online at: https://doi.org/10.21273/HORTTECH.23.3.325 (verified 27 Nov 2019)
- Heinrich, A. L. D. Sullivan, and E. Peachey. 2016. Snap bean nutrient management guide (Western Oregon) [Online]. OSU Extension Publication EM9154. Available at: https://catalog.extension.oregonstate.edu/em9154 (verified 4 March 2017)
- Johnstone, P. R., T. Hartz, M. Cahn, and M. Johnstone. 2005. Lettuce response to phosphorus in high phosphorus soils. HortScience 40:1499—1503. Available online at: https://doi.org/10.21273/HORTSCI.40.5.1499 (verified 27 Nov 2019)
- Kratochvil, R. J., F. J. Coale, B. Momen, M. R. Harrison, Jr., J. T. Pearce, and S. Schlosnagle. 2006. Cropping systems for phytoremediation of phosphorus-enriched soils. International Journal of Phytoremediation 8:117–130. Available online at http://dx.doi.org/10.1080/15226510600678456 (verified 5 Jan 2017)
- McCollum, R. E. 1991. Buildup and decline in soil phosphorus: 30-year trends on a Typic Umprabuult. Agronomy Journal 83:77–85. Available online at: http://dx.doi.org/10.2134/agronj1991.00021962008300010019x (verified 5 Jan 2017)
- Smith, R., M. Cahn, and T. Hartz. 2014. Survey of nitrogen uptake and applied irrigation water in broccoli, cauliflower and cabbage production in the Salinas Valley. California Department of Agriculture Fertilizer Research & Education Program. Project 11-0558-SA. Available online at: https://www.cdfa.ca.gov/is/ffldrs/frep/pdfs/completedprojects/11-0558-SA_Smith.pdf (27 Jan 2020)
- Sullivan, D. M., B. D. Brown, C. C. Shock, D. A. Horneck, R. G. Stevens, G. Q. Pelter, and E.B.G. Feibert. 2001. Nutrient management for onions in the Pacific Northwest [Online]. Pacific Northwest Extension Publication 546. Available at https://catalog.extension.oregonstate.edu/pnw546 (verified 27 Jan 2020)
- University of Delaware. Nutrient management planning for poultry-grain agriculture. Soil testing program fact sheet. Available online at: http://www.udel.edu/DSTP/FactSheets/sto11.htm (verified 5 Jan 2017)
- Warncke, D., J. Dahl, and B. Zandstra. 2004. Nutrient recommendations for vegetable crops in Michigan [Online]. Michigan State University Extension Bulletin E2934. Available for purchase at: http://shop.msu.edu/product_p/bulletin-e2934.htm (verified 4 March 2017)