eOrganic author:
Karen Hoffman, USDA Natural Resources Conservation Service
Source:
Adapted with permission from: Mendenhall, K. (ed.) 2009. The organic dairy handbook: a comprehensive guide for the transition and beyond. Northeast Organic Farming Association of New York, Inc., Cobleskill, NY. (Available online at: https://www.nofany.org/files/TheOrganicDairyHandbook-2009_copy.pdf, verified 22 Nov 2019).
Introduction
Once you have decided how to feed your cows under organic management, it is important to assess your feeding program. Observation is essential to evaluating your success and you will need to learn how to look closely at your cows for signs of problems or changes. It is easy to become engrossed in the day-to-day activities on the farm and to look at cows without really seeing them. This article outlines some tools you can use to evaluate and troubleshoot, as well as corrective actions you can take to solve problems.
Milk Production Trends
One of the easiest ways to determine if the feeding program is on target is to watch the bulk tank. If milk production is consistent from day to day and week to week, that is a good sign the cows are eating a consistent ration that meets their intake and nutrient needs. However, if milk production varies more than five pounds per cow per day, or more than seven pounds per cow per week, there may be a problem with the feeding program. Variability can result from differences in total intake, differences in the amount fed over the course of the day, or differences in pasture yield from paddock to paddock.
Tools to Use
Two tools can be used to help identify the source of milk production variability. The first is a chart to record daily milk weights so you can see the trends in production. Essentially, it is a graph plotted with the daily or bi-daily production per cow. If your milk is picked up every other day, you can use the weights listed on the slip from the milk truck driver.
If your milk weights show a significant daily difference, examine feed delivery in reference to the following factors.
- If more than one person feeds the cows, are there differences in how people mix the total mixed ration (TMR) or weigh a scoop of grain?
- Do these differences result in different rations?
- Which person is making the biggest feeding difference influencing production?
- Meet with all members of the farm who feed the cows to create standard operating procedures (SOP) for feeding and identify where the differences are. This may be as simple as doing one feeding together to determine feeding differences. Include all members of the farm in this discussion and post the SOPs in an easy to find location.
The second tool is used during the grazing season to record information on the paddocks the cows graze every day.
- Record when cows are in each paddock.
- Identify which paddocks result in a drop in milk production.
- Formulate a plan to improve those paddocks.
- Increase the amount of forage fed in the barn on days the cows graze those paddocks.
- Monitor regrowth periods to be sure pasture pre-grazing height is six to eight inches. If the pre-grazing height is tall enough, recalculate the paddock size to make sure it is large enough for the current herd size.
- Alternate grazing between paddocks with different quality or yields after each milking.
Take this tool a step further by measuring pasture yields and growth rates to determine a paddock sequence for grazing. It also indicates when to reserve a paddock for mechanical harvest due to over-maturity. Refer to the Pasture Management on Organic Dairy Farms article series for more detailed information on monitoring paddock size and quality.
Milk Components
Milk components (fat, protein, and other solids) can provide insight into your feeding program, provide sensitive indicators of health, and manage a positive bottom line. Genetics, lactation stage, and the feeding program all influence a cow’s ability to produce components. Under organic production, maintaining higher components can be profitable due to higher component prices compared to conventional.
Butterfat
Of all the components, the feeding program most easily affects butterfat. Butterfat is partially the result of rumen bacteria digesting fiber and producing acetic acid. Acetic acid is used by the mammary cells to produce fat. The more acetic acid, the higher the milk fat content. Likewise, when acetic acid in the rumen is low due to a lack of fiber digestion, butterfat is lower. Rumen pH is also a factor of fat content. On high fiber diets, rumen pH increases because there is more acetic and less propionic and lactic acid production. Rumen pH is important relative to polyunsaturated fats (PUFA) in the diet because PUFA is used to form other fatty acids that depress milk fat synthesis. More acid in the rumen uses more PUFA and butterfat drops. To maintain high butterfat, note the following suggestions.
- Feed a high forage diet to maintain or increase fat production.
- If fat is low, too much grain and not enough forage may be the cause.
- Milk-fat depression may be caused by feeding too much fat—minimize fat sources such as whole soybeans.
Milk Protein
Milk protein is more difficult to influence with changes in the diet and is mostly a result of genetics. To increase milk protein, note the following suggestions.
- Try feeding a small amount of extra protein, but be careful not to overfeed protein as cows use energy to excrete it.
- If the milk protein percent is greater than the milk fat percent, the diet includes too much grain and not enough forage.
- Immediately examine the ration and increase forage intake.
Ratio of First-test Fat Percent to Protein Percent
The ratio of fat percent to protein percent at the first DHIA test after calving can indicate if your fresh cows are at risk for early lactation metabolic problems. If more than 40% of the cows have a first test ratio greater than 1:4, the herd is at risk for ketosis and displaced abomasums. You can calculate the ratio for individual cows with this equation: Percent (%) fat at first test divided by (÷) Percent (%) protein at first test.
If you note abnormalities (greater than 1:4), review the dry cow ration and management to be sure that you are not over-conditioning your cows (Hedtcke et al., 2002).
Fat-to-Protein Inversions
Fat-to-protein inversion occurs when the milk protein level is equal to or greater than the level of milk fat. Dietary fiber directly relates to the fat percentage in milk. One cause of low milk fat is low dietary fiber/high concentrate rations, which puts the herd at risk for subclinical acidosis and laminitis. Other diet-related problems may result from the following.
- Forage chopped too finely.
- Cows able to sort feed while eating, thus not getting the full ration.
- Poor hay quality.
Temporary solutions to resolve acidosis include feeding a buffer (sodium bicarbonate) or feeding a yeast additive that has been approved by your certifier.
Milk Urea Nitrogen (MUN) Levels
If cows consume too much protein and not enough carbohydrates, rumen bacteria convert the protein to ammonia. The ammonia is transported out of the rumen and into the bloodstream where it eventually passes through the liver. The liver converts the ammonia into urea which ends up back in the bloodstream before going to the kidneys for excretion in the urine. On its way to the kidneys, some of the urea also passes through the udder where it is absorbed by the mammary cells and excreted in the milk as milk urea nitrogen (MUN).
MUN levels significantly above 12 mg/dl indicate one or both of the following.
- Cows consumed too much protein.
- Cows did not eat enough carbohydrates.
Most milk handling companies run MUN tests from the bulk tank sample on a regular basis, and testing services such as DHI also do individual cow samples. This is a good troubleshooting tool, especially during the grazing season when the potential for overfeeding protein is highest. If the bulk tank MUN level is within the range of 8 to 12 mg/dl, the ration is on target. If a group or some individuals are outside the desired range, determine if their feeding program is out of balance.
To adjust MUN levels, consider the following.
- If levels are high (greater than 20), assess the feeding program and reduce the protein or increase NFC levels to no higher than 40%.
- If levels are low (less than 4), feed a little more protein.
- Increasing protein may also increase milk production.
- Make changes slowly until MUN increases to the target range.
Rumination (Cud Chewing)
Cows on a high forage diet with adequate fiber levels should spend about one third of their time chewing their cuds, or ruminating. This indicates good rumen health as cud chewing helps to buffer the rumen through saliva production. If cows are not chewing their cuds and making saliva, they may have acidosis or subclinical acidosis which can lead to laminitis in their hooves.
Periodically, assess how many cows are chewing their cuds while at rest to help you troubleshoot problems associated with the feeding program. Since cows spend approximately eight hours per day eating, eight hours resting, and eight hours ruminating, at any one time you should count 60% to 80% of the herd chewing their cuds.
If very few cows are chewing their cuds, consider the following.
- The diet may contain too much grain and not enough forage.
- There may be inadequate fiber or NDF levels in the ration.
- Cows may be off-feed.
- There may be low forage available in the paddock, changing the forage to grain ratios. Measure pasture yields and growth rates to ensure correct pasture intake.
Body Condition Scoring (BCS)
Taking the time to routinely look at body condition on your cows, bred heifers, and dry cows is important. Body condition scoring (BCS) indicates your cows’ energy status as they mobilize fat in the early stages of lactation. They should not lose more than one condition score from calving until just past their peak milk production. If they do, it will be difficult for them to gain it back before they dry off. You should also score your bred heifers and dry cows to ensure they are neither too fat nor too thin at calving time.
The system of body condition scoring for dairy cattle uses a scale of "1" to "5," with "1" being extremely thin and "5" being extremely fat. The average of milking cows in herds that calve year round should be close to "3." In seasonal herds, the average is "3" by 150 to 175 days in milk. There should not be any "1" or "5" scores in your herd. If there are, determine why and develop a plan to improve condition. Dry cows and heifers should have a body condition of at least "3" and no more than "4."
The BCS system uses fractions of whole numbers or a plus/minus system to describe cows that are in-between scores. A cow with a little more condition than a "3" might be described as a "3.25" or "3.5," and one with less condition might be a "2.75" or "2.5." The most important places to look for condition are on the short ribs, spine, and around the tail head. The more bone definition in these areas, the lower in condition the cow is, and vice versa. Grazing cows have better muscle tone due to walking, so do not confuse an athletic cow with a thin cow.
One condition score is equivalent to 200 Mcal of NEL so if the cows are too thin by 100 days in milk, they will need to be fed one Mcal per day extra for the last 200 days to put the condition back on before drying off. If you wait longer than 100 days to assess them, the ration will need to have even more energy.
Assessing and recording BCS every month or two will help you discover problems before it is too late to fix them. Have someone who does not see the cows every day do the scoring for you, as their assessment may be more objective. Also, recognize there are some cows that are simply thin all the time, no matter how well you feed them. You may want to exclude those cows from the average, as well as any cows that have struggled with other health problems and become thin.
Locomotion Scoring
Locomotion scoring can help you assess rumen health and the overall well-being of your cows. This tool helps identify lame cows and the degree of their lameness. In many cases, lameness results from laminitis, caused by an acidic rumen. Heel warts, bruises, abscesses, or foot rot can also cause lameness. Identifying even mildly lame cows before the problem progresses and checking their hooves can help solve problems early.
Locomotion scoring uses a scale of "1" to "5," with "1" being normal and "5" being severely lame. A cow that is not lame stands and walks normally with a flat back. Once they begin to feel any pain in their feet, they begin to walk with a slightly arched back and walk with a slight change in their gait. From there, as the lameness progresses, their back arches most of the time, their gait becomes progressively awkward, and they may favor the legs that are not painful to walk or stand on. A severely lame cow will have difficulty walking or standing at all. As a benchmark, fewer than 2% of your cows should have lameness.
Once you have identified cows with a locomotion score greater than "1," you or your hoof trimmer need to lift the affected feet to assess the problem. If it is a nutritional problem resulting from acidosis, you will see sole ulcers, usually in all four feet. Unfortunately, laminitis caused by acidosis does not appear until a few months after the cows were acidodic, so the ration may have changed since the actual problem occurred. If you have not changed the ration in a while, acidosis may still be a problem and you should check your feeding program for adequate forage and fiber.
Fortunately, if you feed a high forage diet and minimal grain, the feeding program will likely not cause lameness problems. When cows are on pasture, they are less likely to have acidosis unless pasture intake is limited.
Manure Scoring
Manure scoring can help evaluate how well the ration is balanced for protein, fiber, and carbohydrates. It can also assess if the cows are digesting the feed correctly and if water intake is appropriate. This tool is helpful in evaluating pasture-based diets as the manure gives a good indication of whether too much protein is being supplemented, too much forage is being fed in the barn, or whether the rumen bugs are utilizing grain for energy.
Once again, this system uses a score of "1" to "5," with "1" being very liquid and "5" being very stiff. In practical use, a score of "1" would slide off your boot, a score of "3" would stick to your boot, and a score of "5" would bounce off your boot (Cow comfort [Online], DeLaval Global). Refer to photos below for more information.
Score 1
Manure is runny with a consistency of pea soup (see Figure 1). The manure may arc from the rump of the cow. Excess protein or lack of fiber can lead to this consistency, typical of early spring pasture-based diets. If Score 1 continues past early spring, there may be too much protein being supplemented in the barn. Cows with diarrhea or Johne’s disease will also score in this category.
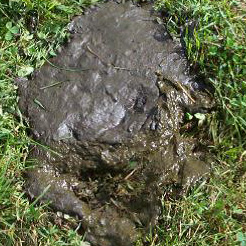
Figure 1. Photo credit: Robert DeClue, USDA Natural Resources Conservation Service.
Score 2
Manure is runny and does not form a distinct pile, rather it splatters when it hits the ground or concrete (see Figure 2). This is typical of cows on pasture after the spring flush and if little supplemental forage is fed in the barn. If seen in full stored forage confinement feeding, the cows may lack adequate fiber in their diet and have acidosis.

Figure 2. Photo credit: Robert DeClue, USDA Natural Resources Conservation Service.
Score 3
Manure has the appearance of pudding, and will form a pile with concentric rings around a small depression in the middle (see Figure 3). It makes a plopping sound when it hits the floor or ground and sticks to shoes, pasture sticks, and the flanks of cows that lay in it. Cows fed pasture, some stored forage, and adequate energy without extra protein will attain this manure score. Cows on stored forages in the winter with properly balanced grain mix, will also produce this kind of manure. Score 3 is optimal.

Figure 3. Photo credit: USDA Natural Resources Conservation Service Photo Gallery.
Score 4
Manure is considerably thicker and will make a taller pile (see Figure 4). It will stick to your shoe, but is not as easily wiped off as with Score 3 manure. This is more typical of dry cows, older heifers, and any group of animals fed low-quality forages. It may indicate a lack of protein in the diet.
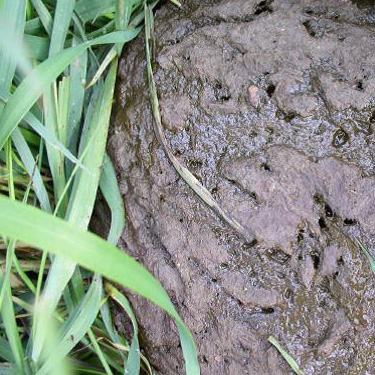
Figure 4. Photo credit: Robert DeClue, USDA Natural Resources Conservation Service.
Score 5
Manure is stiff, firm, and possibly in the shape of a ball (see Figure 5). This indicates extremely low quality forage, a digestive blockage, or dehydration. If you feed relatively good-quality forage and see manure of this consistency, you need to call a veterinarian because death of the animal is possible due to digestive blockage or dehydration.
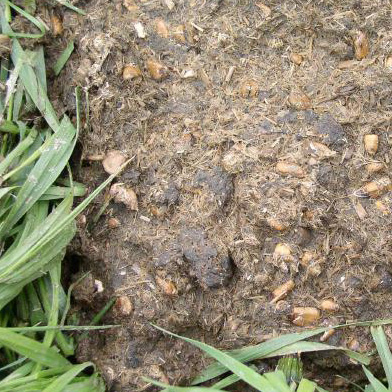
Figure 5. Photo credit: Robert DeClue, USDA Natural Resources Conservation Service.
If you are willing to feel manure for texture and consistency, you can score it by hand. The following guidelines provide a reference for this examination.
- Score 1: Manure feels like a creamy homogenous mixture. There are no visible undigested food particles.
- Score 2: Manure feels like a creamy homogenous mixture. There are a few visible undigested food particles.
- Score 3: Manure does not feel homogeneous. Some undigested particles are visible. When you squeeze the manure in your hand, some undigested fibers will stick to your fingers.
- Score 4: Undigested food particles are clearly visible and are larger than in Score 3. When you squeeze the manure in your hand, a ball of undigested food will remain.
- Score 5: Larger food particles are clearly visible in the manure and it is easy to distinguish the undigested components of the feed ration (Karreman, 2007).
To troubleshoot your feeding program with manure scoring, walk through the barn or pastures and look at the consistency of the manure.
Cows on Pasture
Cows on pasture tend to have looser manure, due to the combination of high protein, low fiber, low dry matter content (80% water and 20% dry matter), and highly digestible feed. This is acceptable as long as it is close to "2" on the score. If cows on pasture have scores of "4" or "5" or if there is a lot of grain in the manure, you need to reassess how much you feed in the barn. If the manure is very stiff, you may not be meeting the 30% pasture requirement and feeding too much forage in the barn. If there is a lot of grain in the manure on pasture, you may need to grind it more finely for the rumen bacteria to be able to utilize it.
Cows in the Barn
When cows are in the barn on stored feeds, the manure should average a score of "3." If the manure is closer to a score of "2" and you can smell ammonia in the barn, you may be feeding too much protein. If the manure is very stiff and scores above a "4," you either need to feed higher quality forage or increase the protein level in the grain.
Overall Nutrition Assessment
The cows themselves provide you the best assessment of whether or not the feeding program meets their needs and if they feel healthy. Although the tools discussed above help you pinpoint areas that need changes based on physical signs, there are also behavioral indicators.
Well-fed, healthy cows are bright-eyed and approach you with their ears up and forward, walk with energy in their step, and are curious about their environment. If they keep to themselves, put their ears back, and are slow to move, they may have a nutritional or health problem.
Another sign of good nutrition and health are "health lines;" some farmers and veterinarians refer to them as “happy lines” (Karreman, 2007), see Figure 6. These lines appear on the side of the cow in the rib area, usually running horizontally. They are usually faint, and you have to stand in the right light and angle to the cow to see them. Scientists do not know what causes them, but they indicate good health and possibly good rumen function.
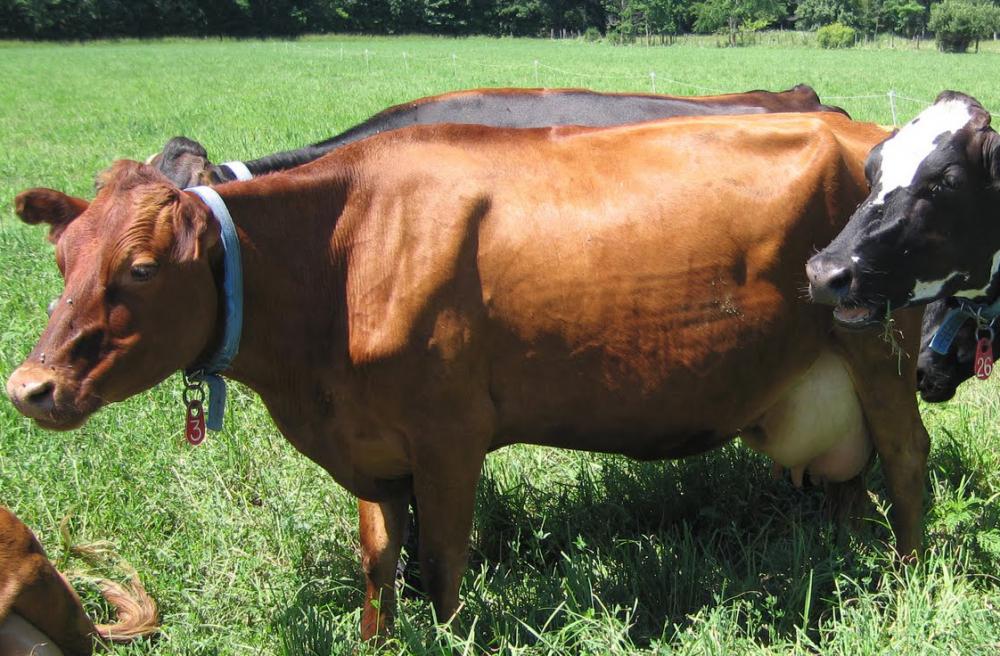
Figure 6. Happy lines on healthy cow. Photo credit: Amanda Gervais, University of Vermont Extension.
Conclusion
Successful organic dairy farming is dependent upon your ability to be observant of all aspects of animal health and nutrition and to make changes quickly once a problem is identified. High-quality forages, high forage intake, and a minimum of grain are key to profitability.
Also in This Series
This article is part of a series discussing organic dairy nutrition. For more information, see the following articles.
- An Introduction to Nutritional Concepts and Terminology
- Identifying Nutritional Goals
- Nutritional Requirements and Rations
- Forage Testing and Interpreting Lab Analyses
- Managing Seasonal Diet Shifts
- Assessing the Feeding Program
References and Citations
- Bishop-Hurley, G., R. Kallenbach, C. Roberts, and S. Hamilton (ed.). 2002. Dairy Grazing Manual. MU Ext. Publ. M168. University of Missouri, Columbia, MO.
- Crowley, J., N. Jorgensen, T. Howard, P. Hoffman, and R. Shaver. 1991. Raising dairy replacements. North Central Regional Extension Publication 205. University of Wisconsin Extension, Madison, WI.
- Hedtcke, J., D. Undersander, M. Casler, and D. Combs. 2002. Quality of forage stockpiled in Wisconsin. Journal of Range Management 55(1):33-42.
- Hoffman, K., R.DeClue, and D. Emmick. 2000. Prescribed Grazing and Feeding Management of Lactating Dairy Cows. NYS Grazing Lands Conservation Initiative/USDA-NRCS. Available online at: http://grazingguide.net/extension/feeding-management-for-lactating-dairy-cows.html (verified 22 Nov 2019).
- Karreman, H.J. 2007. Treating dairy cows naturally. Acres USA, Austin, TX.
- National Research Council. 2001. Nutrient requirements of dairy cattle: seventh revised edition. The National Academies Press, Washington, DC.
- Overton, T. R. and M. R. Waldron. 2004. Nutritional management of transition dairy cows: Strategies to optimize metabolic health. Journal of Dairy Science 87:E105–E119.
- Padgam, J. (ed). 2006. Organic Dairy Farming: A Resource for Farmers. Orang-utan Press.
- Paine, L., and K. Barnett. 2007. Stockpiling pasture. Grass Clippings 2(3): 3-5. University of Wisconsion Extension, Madison, WI. Available online at: http://www.cias.wisc.edu/wp-content/uploads/2008/07/pasturenews807.pdf (verified 2012 August 31).
- Soder, K.J., Hoffman, K., Chase, L.E., Rubano, M.D. 2012. Case study: molasses as the primary energy supplement on an organic grazing dairy farm. Professional Animal Scientist. 28:234-243.
Additional Resources
- Dairy One [Online]. Dairy One Cooperative, Inc. Available at: http://www.dairyone.com (verified 2012 August 31).
- Cow comfort [Online]. DeLaval Global. Available at:https://www.delaval.com/en-us/our-solutions/cow-comfort/ (verified 15 Nov 2019).
- Agricultural Marketing Service—National Organic Program [Online]. United States Department of Agriculture. Available at: http://www.ams.usda.gov/nop/ (verified 2012 August 31).
- Northeast Pasture Consortium Grazing Guide [Online]. Northeast Pasture Consortium. Available at: http://www.umaine.edu/grazingguide (verified 2018 August 14).
- Premier Molasses [Online] Premier Molasses Company. Available at: http://www.premiermolasses.ie (verified 22 Nov 2019).
- Thorvin [Online]. Thorvin, Inc. Available at: http://www.thorvin.com (verified 2012 August 31).