eOrganic authors:
Brian Baker, Oregon State University
Brigid Meints, Oregon State University
Patrick Hayes, Oregon State University
- Organic and Naked (Hull-less) Barley
- Practices, Production Costs, and Benefits
- Introduction
- Methodology
- Results
- Production Obstacles
- Suggestions for Breeding, Selection and Improvement
- Costs of Production
- Advantages and Disadvantages of Naked Barley
- Conclusion
- References
- Appendix A: Assumptions and Estimated Costs
- Appendix B: Model Barley Budgets by Region, Season, and End Use
Introduction
Barley offers numerous advantages for organic farmers. As a small grain added to a crop rotation, it can help improve soil health, maintain fertility, and break pest and disease cycles. In areas where it can be grown as a winter crop, barley can help suppress weeds. Barley requires less nitrogen than other small grains, establishes quickly, and matures earlier than wheat, rye, or oats. An earlier harvest date allows for a bigger planting window for subsequent crops. Cost of production is relatively low, and it can be grown in a wide range of soil types and conditions.
Another advantage of barley is the versatility of its end uses and diversity of marketing channels. Barley can be malted and used for brewing and distilling. It can also be eaten as a whole grain, made into flour, or fed to livestock. As a livestock feed, it can be harvested as a mature grain and milled, fed free-choice, or harvested immature as green chop and made into haylage. Barley can also be grown as a cover crop, either by itself or in a blend with legumes and forbs.
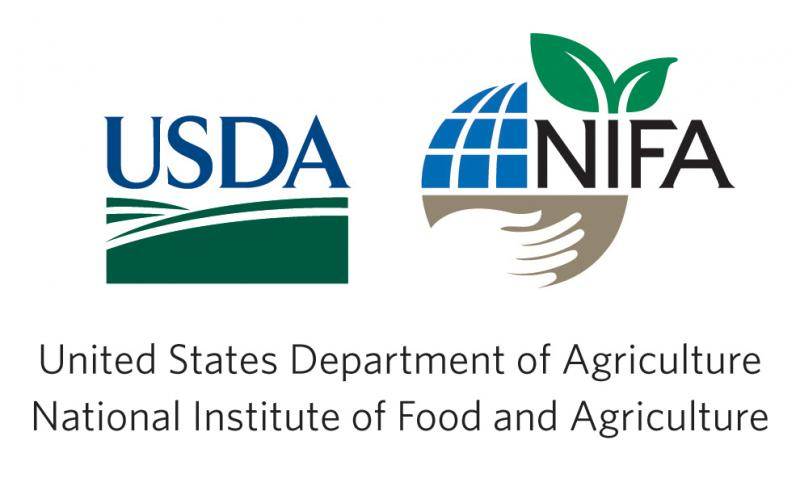
Barley can either be covered (hulled) or naked (hull-less) (Fig. 1). When covered barley is dehulled or pearled, some of the germ and bran is removed, reducing the nutritional content and resulting in a product that is no longer a whole grain. For farmers with limited equipment and those who direct market, a free-threshing naked barley does not require as much in the way of processing beyond screening and cleaning.
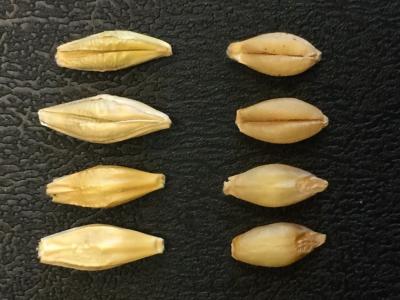
Figure 1. Image of covered (top) and naked barley (bottom) kernels.
Photo credit: Brigid Meints, Oregon State University
Despite its advantages, organic barley production has been limited. Approximately 2 million acres of barley are grown annually in the United States, but according to the 2016 Certified Organic Survey, only 51,254 acres were organic (NASS, 2016). To determine why organic farmers do not produce more barley, researchers conducted a survey with follow-up interviews and performed an economic analysis on the costs of production based on the data.
Methodology
To inform the breeding process and to understand what qualities, traits, and characteristics organic farmers consider important, the authors designed and implemented a survey and conducted interviews with organic barley producers. The survey was conducted between February 11 and April 1, 2019, with 81 valid responses from an adjusted target audience of 368. More detailed information on the methods, results, and the survey instrument itself can be found in a report published on the project's website (Baker, Meints, and Hayes, 2019).
Following the survey, 19 certified organic barley producers were interviewed about their production practices, costs of production, specific obstacles that they face in growing high-quality organic barley, and any suggestions for breeding, selection, and improvement of barley grown in organic conditions, with specific questions about interest in producing naked barley.
The barley producers were all certified organic with at least five years of organic farming experience. They were selected based on geographic diversity, different end uses, and a range of scale. Average farm size was 1,000 acres, with approximately a quarter planted to small grains in general. Average barley planting for the 2019 crop season was 125 acres. Most of the producers grew barley for feed, but producers of malting, food, and seed barley were also interviewed in each of the regions. About an even number of dryland (10) and irrigated (9) producers were interviewed. The interviews were divided into three parts: a narrative description of how barley fit in the farming system, a detailed accounting of the production practices specific to barley, and an open-ended discussion of the challenges that producers face in growing organic barley and desired traits for barley improvement.
Fig. 3 shows a map of the locations of the barley producers who completed the survey. The largest number of respondents (43) were in the USDA's National Institute of Food and Agriculture's (NIFA) Western region. The North Central (24) and Northeast (14) regions had most of the remaining respondents, with only 3 from NIFA's Southern region.
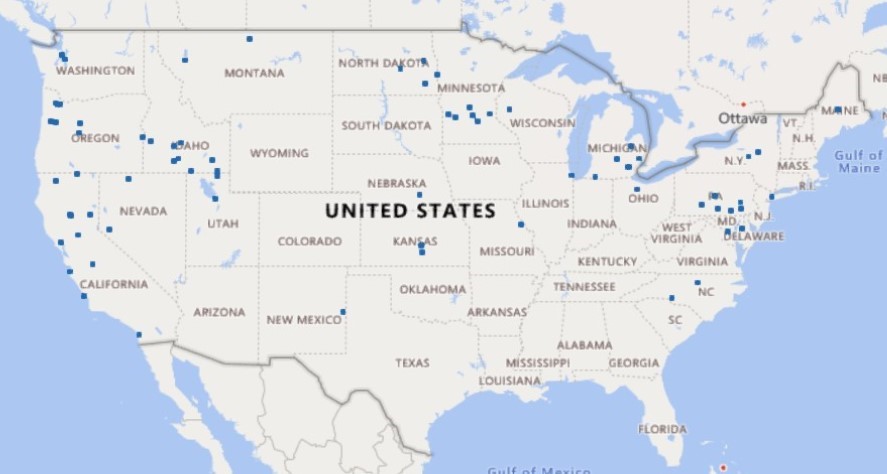
Figure 2: Location of survey respondents. Source: (Baker, Meints, and Hayes, 2019)
Production Obstacles
Producers were asked in the survey to identify what obstacles limited their barley production. Their responses were followed by in-depth interviews. The main obstacles are summarized in Figure 3.
Figure 3: Obstacles to growing organic barley as reported by survey respondents. Source: (Baker, Meints, and Hayes, 2019)
Nearly half the producers said that the main limitations were economic, citing limited markets (25%) and price (23%) as reasons why they don't grow more barley. The interviews provided more insights. According to the farmers interviewed, malt houses and food-grade barley processors are unwilling to pay premiums above the feed market prices. Competition with imports was an issue that interview subjects identified as a reason why they don't grow more barley.
On the survey, fewer than 10% of farmers considered diseases, weeds, or poor yields their most significant obstacle. Interviews revealed that the 2019 season was unusually wet in many parts of the country. In the Northeast and North Central regions, many producers were not able to till until after the window for planting spring small grains had passed. Continued cool weather and rain through the summer slowed maturity and made harvest difficult. Some producers were unable to plant barley, and several who were able to plant and harvest a barley crop reported their lowest historical yields. Production challenges because of the wet conditions included lodging, high moisture at harvest, diseases, and sprouting. In contrast, many producers in the Western region reported that they did not need to irrigate, and several producers recorded their highest actual yields to date.
Crop-limiting diseases reported included Fusarium head blight (FHB) (incited by Fusarium spp.) in the Northeast, and stripe rust in the North Central region. Western region producers reported that barley yellow dwarf virus appears to be a problem for them when barley followed corn. Despite the wet weather, some producers in the Northeast and North Central region did not attribute loss of yield to diseases, but rather to lodging.
Suggestions for Breeding, Selection, and Improvement
The survey asked organic barley producers to rank their most desired traits for breeding, selection, and improvement. Yield was named the most desirable trait by nearly half the respondents, and 82% named it as one of the top three. Prioritization of yield was consistent in all regions and end uses. Other desirable traits had strong regional preferences. Several producers noted in their interviews that they had tried growing varieties that were bred and selected in other regions with disappointing results. Producers reported declining yields for varieties that did well a few years ago and suspected climate change to be a possible explanation. Barley growers in the North Central and Northeast regions—and colder areas in the Western region such as Colorado and Montana—named winter hardiness as a trait that they wanted to see improved. One producer in the Appalachian area of the Southern region cited winter hardiness as a priority second to yield, underscoring barley's importance as an overwintering crop in organic farming systems in much of the United States. California growers and others in the Western region expressed a preference for varieties with low water requirements and drought tolerance.
Nearly half of all respondents ranked competitiveness with weeds as either the second or third choice. Producers who had specific plant pathogen problems ranked disease resistance as a priority. Early germination and nutritional quality were also ranked as a priority by over 10% of the respondents. Traits named by fewer than 10% of the producers included malting quality, sensory quality, seed coat color, fiber content, and “Other”. Several producers in the “Other” category specifically cited lodging as a problem to be possibly resolved by barley breeding.
Table 1: Barley Traits Ranked in Importance by Organic Producers
| Weighted Rank | Trait | % 1st | %2nd | %3rd | Total % |
| 1 | Yield | 48 | 24 | 10 | 82 |
| 2 | Drought Tolerance | 10 | 7 | 23 | 40 |
| 3 | Winter Hardiness | 8 | 21 | 15 | 44 |
| 4 | Competitiveness with Weeds | 2 | 19 | 20 | 41 |
| 5 | Disease Resistance | 8 | 10 | 10 | 28 |
| 7 | Nutritional Quality | 8 | 5 | 3 | 16 |
| 8 | Early Germination | 2 | 5 | 10 | 17 |
Source: Baker, Meints, and Hayes, 2019
While disease resistance was a relatively low priority overall, it was seen as particularly important in the humid Northeast and the Lake States of the North Central region. Resistance to mycotoxin-producing fungi was a priority for feed and food producers. Fusarium head blight (FHB)-induced stem breakage might be misdiagnosed as lodging. Breeding for resistance to FHB may be more important than the survey results indicate, based on follow-up interviews.
Most of the survey respondents had no experience with naked barley, but about 25% had grown naked barley at least once in the past three years. One such variety grown was Streaker (Fig. 4). The primary obstacle identified by producers who had grown naked barley was access to seed, followed by yield. Other reasons given for not growing more naked barley were lack of winter hardiness, no or inadequate premium above what is paid for hulled varieties, and the lack of dedicated storage capacity. Some producers expressed disappointment that naked barley did not completely free-thresh (hulls on the naked barley would remain on the seed after cleaning). Most respondents (55%) indicated that they would be willing to grow a multi-purpose naked barley suitable for malting, food, and feed, and another 42% said they may be willing to grow it.
Figure 4: Streaker barley, Klamath County, OR, 2015
Photo Credit: James Henderson, Hummingbird Wholesale
Costs of Production
Interview subjects were asked to provide detailed information about their farming operations. The interviewees described the various operations used for soil preparation, planting, cultivation, and harvesting, including the amount of time spent and specific equipment used. Responses included amounts and costs of specific inputs such as fertilizers, soil amendments, and seeds. Budgets were prepared based on the interviews and are shown in Appendix A. Actual cost data were used when readily available and verified, or adjusted using secondary sources. When producers could not directly provide costs of production, the data provided about farming operations were used to estimate equipment fuel, operation, and maintenance costs based on the manufacturer's specifications, engineering references, and the most recent edition of relevant Cooperative Extension data (Downs and Hansen, 1998; Grisso et al., 2010; Painter, 2011).
Interview subjects were asked to provide estimated hours per acre of operations, including fuel consumption data as well as the hours of labor spent per operation. Where hours per acre were not readily available, but ground speeds and equipment complements were, the following equation was used to estimate hours per acre (Painter, 2011):
(Miles per hour x Width of equipment x Field Efficiency) / 8.25
Capital recovery of machinery and equipment and other allocated overhead expenses not provided by the interviewees were extrapolated from the regional averages provided by the USDA survey of barley producers following the 2014 Census of Agriculture (USDA-NASS, 2019a). Interviewees were asked about their land costs including cash rent, mortgage payments, and property taxes. In cases where actual rents or total cost of land and net cost of buildings and improvement was not available, rents reported by the most recent USDA survey on land rents by county were used for the opportunity cost of land (USDA-NASS, 2019b). Certification costs per acre were provided by the producers when available; otherwise, the budgets used average cost per acre in the state of the operation from 2016 adjusted for inflation (USDA-NASS, 2017). Additional data was supplemented from estimated costs and returns for commodity crops complied by the USDA's Economic Research Service (USDA-ERS, 2020). Model budget data were verified by the interviewees.
In the absence of specific values provided by the interviewees, the USDA standards for #2 generic (non-malting) barley were used as the default values for test weight (USDA-GIPSA, 1997). The values were for covered barley in the absence of specific varieties. Higher grades and test weights would result in higher returns per acre, all other things being equal. The USDA does not have standards for naked varieties. Weight and volume conversion factors for naked barley were obtained from the Canadian Grain Commission (Canadian Grain Commission, 2006).
Costs of production, yields, revenues, and gross margins varied by region, target market, and whether the farm was dryland or irrigated. In addition to the SARE regions, the farms were also grouped by the geographic regions identified by the Economic Research Service (USDA-ERS, 2020).
Table 2 provides the average costs and returns experienced by the producers who planted and harvested barley grain for feed, food, or malting in all regions of the US. It did not include producers who grew barley as a cover crop, for seed, or for hay or green chop. Barley grown in the United States has low operating costs, high capital costs, and tends to be a low-margin or break-even crop. Net margin was slightly negative given the relatively high capital investment costs. However, there were great regional differences in cost of product as well as return per acre. Irrigated farms had higher costs of production, but also higher gross value and, based on the interviews, less risk of crop failure in a dry year.
Table 2: Organic Barley Costs and Returns
|
| Dryland ($ / A) | Irrigated ($ / A) | All ($ / A) |
| Gross Value | 470 | 611 | 541 |
| Operating Costs | 137 | 218 | 190 |
| Allocated Overhead | 126 | 168 | 147 |
| Value Net of Operating Costs | 333 | 394 | 351 |
| Value Net of Total Costs | 207 | 225 | 204 |
Costs also varied according to end use or target market. Feed barley had the lowest costs of production, particularly when grown to be fed to livestock raised on the same farm. Malt and food barley costs were comparable and are combined in the model budgets. Because seed barley costs of production are specific to variety as well as geographic region, these are not reported separately. Producers interviewed reported gross margin net of operating costs of $469/A for food barley, $386/A for malting barley, $328/A for feed barley, and $197/A for barley grown for seed. Seed production required greater labor and had low net yields in 2019 because the wet year resulted in abnormally high rejection rates.
Detailed model budgets are included in Appendix A, along with the assumptions used to derive estimated costs. Producers can also use a budgeting tool, such as the OGRAIN Compass, to estimate costs of production where local cost conditions vary or if variable costs change (Hendrickson, Munsch, and Silva, 2019). While irrigated barley had higher costs per acre, it was more productive and had lower costs per bushel.
Advantages and Disadvantages of Naked Barley
Most barley produced in the United States has a hull because breeding efforts have focused on malting quality, where the hull offers some benefits. However, naked barley offers several potential advantages. Varieties that thresh freely do not need to have the hull removed before being sold as food or feed for non-ruminants. Table D summarizes rough estimates of the economic and environmental benefits of naked barley. Values will vary regionally and from year-to-year based on prices. Production costs are assumed to be roughly equal, but with low yields of naked barley may overwhelm the benefits.
Removal of the hulls on-farm requires the investment in special equipment and takes labor and energy to operate. Investment in a commercial capacity dehuller can cost between $15,000 and $70,000 with differences in capacity and performance. Cost of hull removal of ancient grains can range from 2¢ to 20¢/lb depending on the equipment used and capacity (Baker, 2015). In varieties where the hull adheres to the grain, some nutrients are lost with the removal of the hulls. Naked barley can be marketed as a whole grain; pearled barley cannot. The hulls are added weight for transportation with no nutritional or malting value. Farmers that direct market through CSAs and farmers markets on a relatively small scale will have lower capital and labor requirements with free-threshing varieties. For calculating the benefits, a cost of $4.20/ton and 7.5 kWh/ton were used.
Grain transportation costs depend on several factors, including regional variability, seasonal fluctuations, age of equipment, and road conditions. Farmers interviewed reported costs between $2 and $4 per loaded mile, with a $2.47/mile and $0.395/bushel-acre reasonable average for fuel and allocated overhead (Edwards, 2017). Assuming fuel consumption of 5 mpg, and a dead weight loss of 12% on the hulls, the cost advantage of not shipping the hulls was estimated to be about $5.14/loaded ton with an advantage of $0.30 per mile. For a 5-mile haul, the advantage would be $3.97. Greenhouse gas emission benefits were estimated using carbon dioxide coefficients published by the Energy Information Administration (EIA, 2016).
The main disadvantage cited by the producers interviewed was the relatively low yields of naked barley. Organic producers surveyed reported an average yield of 2,037 lb/A for naked barley, compared with an average yield of 2,961 lb/A for covered barley. The additional weight of the hull can range between 10% and 13%, with 12% being a reasonable assumption for estimation purposes. When the weight of the hull is factored out of yields, the difference between naked and covered varieties is narrowed. In Appendix C, Table C1 shows a comparison of 18 covered and 2 naked varieties grown in trials in the winter in two locations and in the spring in three locations over the past three years. The results have not been analyzed for statistical significance and are preliminary. However, they provide a rough estimate of the differences. Yields and yield differences varied widely, making it difficult to generalize. However, not having a hull still has advantages even if grain yield net of the hull is not significantly different.
While hulls may have some economic value, they have no direct nutritional value. Another factor that differentiates naked barley is greater nutrient density and higher amounts of crude protein. Table C2 shows a comparison of 18 covered and 2 naked barley varieties grown in trials in two locations in winter and spring, 2018 and 2019. Naked barleys were consistently higher in mean protein levels by about 1%. Again, the data are preliminary, and the statistical significance has not been analyzed. However, if the results remain consistent over time, naked barley could have substantial benefits for feed and food uses. A 1% increase in protein content would be 20 lb/ton.
Farmers also reported that naked spring barley varieties appeared to be less vigorous and competitive with weeds relative to hulled spring varieties. Planting areas were also smaller, resulting in fewer economies of scale.
Figure 5: Organic Karma Barley, Agency Lake Farm, Chiloquin, OR, 2020. Photo Credit: James Henderson, Hummingbird Wholesale.
Discussion
Market research would help understand how to overcome the market barriers identified by the producers surveyed and interviewed. Downstream users of barley could create market opportunities. Qualities and traits not identified by barley producers may be priorities for maltsters, millers, retailers, and livestock producers.
In addition to the lack of market opportunities for organic barley, current varieties may not be best suited for organic production. As with most crops, modern varieties are bred and selected under conditions that include the use of synthetic fertilizers and herbicides, and not necessarily best adapted for organic farming conditions. New varieties bred for organic systems that meet quality standards to be sold into multiple markets may encourage farmers to add barley to their rotations.
In principle, it is possible to breed a naked barley suitable for feed, food, and malting that will perform well in organic systems. However, there are trade-offs between the different end uses, as well as the qualities desired for different end uses and target markets (Meints and Hayes, 2020).
Conclusion
Barley has the potential to serve as a rotation crop in many different organic farming systems. Organic barley producers surveyed identified economic factors, particularly price and low return, as the main obstacles limiting barley plantings. Those taking the survey identified yields as the most important trait for selection and improvement. Versatile naked barley varieties will provide options for different end uses and markets. Producers interviewed said that greater adoption of naked varieties will require better yield and a premium price for naked varieties.
References and Citations
- American Petroleum Institute (API). 2020. Motor fuel taxes [Online]. American Petroleum Institute, Washington, DC. Available at: https://www.api.org/oil-and-natural-gas/consumer-information/motor-fuel-taxes (verified 22 Dec 2020).
- American Society of Agricultural Engineers (ASAE). 2000. Agricultural machinery management data. ASAE D497.4 Mar 99. American Society of Agricultural Engineers, St. Joseph, MI.
- Baker, B. 2015. Dehulling ancient grains: Economic considerations and equipment [Online]. eXtension Foundation, eOrganic Community of Practice. Available at: https://eorganic.org/node/13028 (verified 22 Dec 2020).
- Baker, B. P., B. M. Meints, and P. M. Hayes. 2019. Improving barley for organic producers: What do organic producers want? Oregon State University, Corvallis, OR. (Available online at: https://eorganic.info/sites/eorganic.info/files/u461/Organic_Barley_Producers_Survey_Results.pdf) (verified 22 Dec 2020).
- Baker, B. P., B. M. Meints, and P. M. Hayes. 2020. Organic barley producers' desired qualities for crop improvement. Organic Agriculture. (Available online at: https://doi.org/10.1007/s13165-020-00299-y) (verified 22 Dec 2020).
- Canadian Grain Commission. 2006. Test weight conversion chart: Hulless barley [Online]. Canadian Grain Commission, Winnipeg, MB. Available at: https://www.grainscanada.gc.ca/en/grain-quality/grain-grading/grading-factors/conversion-charts/pdf/hulllessbarley.pdf. (verified 22 Dec 2020).
- Downs, H. W., and R. W. Hansen. 1998. Estimating farm fuel requirements [Online]. Extension Fact Sheet 5.006. Colorado State University, Ft. Collins, CO. Available at: https://www.hort360.com.au/wordpress/uploads/Energy/Machinery%20Tractors/Estimatiing%20Farm%20Fuel%20Requirements.pdf (verified 22 Dec 2020).
- Edwards, W. 2017. Estimating grain transportation costs [Online]. Ag Decision Maker File A3-41. Iowa State University, Ames, IA. Available at: https://www.extension.iastate.edu/agdm/crops/pdf/a3-41.pdf (verified 22 Dec 2020).
- Energy Information Administration (EIA). 2016. Carbon dioxide emission coefficients [Online]. US Energy Information Administration, Washington, DC. Available at: https://www.eia.gov/environment/emissions/co2_vol_mass.php (verified 22 Dec 2020).
- Energy Information Administration (EIA). 2020. Weekly retail gasoline and diesel prices [Online]. US Energy Information Administration, Washington, DC. Available at: https://www.eia.gov/dnav/pet/pet_pri_gnd_dcus_nus_a.htm (verified 22 Dec 2020).
- Grisso, R. D., J. V. Perumpral, D. H. Vaughan, G. T. Roberson, and R. M. Pitman. 2010. Predicting tractor diesel fuel consumption. Publication 442–073. Virginia Cooperative Extension, Blacksburg, VA. (Available online at: https://vtechworks.lib.vt.edu/bitstream/handle/10919/47472/442-073_pdf.pdf) (verified 22 Dec 2020).
- Hendrickson, J., J. Munsch, and E. Silva. 2019. OGRAIN Compass [Online]. College of Agriculture and Life Sciences, University of Wisconsin-Madison. Available at: https://ograin.cals.wisc.edu/resources/ograin-compass/ (verified 22 Dec 2020).
- Meints, B. M., and P. M Hayes. 2020. Breeding naked barley for food, feed, and malt. Plant Breeding Reviews 43:95—119. (Available online at: https://doi.org/10.1002/9781119616801.ch4 (verified 22 Dec 2020).
- Painter, K. 2011. The costs of owning and operating farm machinery in the Pacific Northwest. Pacific Northwest Extension 346. University of Idaho, Moscow, ID. (Available online at: https://www.extension.uidaho.edu/publishing/pdf/PNW/PNW0346/PNW346.pdf (verified 22 Dec 2020).
- Torell, R., and J. Balliette. 1993. Beef cattle handbook: Pricing protein and energy supplements BCH-5451 [Online]. Extension Beef Cattle Resource Committee, University of Wisconsin-Extension, Cooperative Extension. Available at: http://www.iowabeefcenter.org/bch/PricingSupplements.pdf (verified 22 Dec 2020).
- USDA Economic Research Service (USDA-ERS). 2020. Barley production costs and returns per planted acre, excluding government payments [Online]. Available at: https://www.ers.usda.gov/data-products/commodity-costs-and-returns/commodity-costs-and-returns/#Historical%20Costs%20and%20Returns:%20Barley (verified 22 Dec 2020).
- USDA Grain Inspection, Packers and Stockyards Administration (USDA-GIPSA). 1997. United States standards for barley [Online]. US Department of Agriculture Grain Inspection, Packers and Stockyard Administration, Washington, DC. Available at: https://www.gipsa.usda.gov/fgis/standards/810barley97.pdf (verified 22 Dec 2020).
- USDA National Agricultural Statistics Service (USDA-NASS). 2017. 2016 Certified organic survey [Online]. USDA-NASS, Washington DC. Available at: https://www.nass.usda.gov/Surveys/Guide_to_NASS_Surveys/Organic_Production/ (verified 22 Dec 2020).
- USDA National Agricultural Statistics Service (USDA-NASS). 2019a. Census of Agriculture 2017 [Online]. USDA-NASS, Washington DC. Available at: https://www.nass.usda.gov/Publications/AgCensus/2017/ (verified 22 Dec 2020).
- USDA National Agricultural Statistics Service (USDA-NASS). 2019b. Surveys: Cash rents by county [Online]. USDA-NASS, Washington DC. Available at: https://www.nass.usda.gov/Surveys/Guide_to_NASS_Surveys/Cash_Rents_by_County/ (verified 22 Dec 2020).
Appendices With Model Budgets
The following model budgets are prepared as planning tools. Actual producer costs and returns may vary widely according to weather, market conditions, and other variables. Producers are encouraged to research current and anticipated market conditions and use a budget tool, such as the OGRAIN Compass (Hendrickson, Munsch, and Silva, 2019).
Appendix A: Assumptions and Estimated Costs
Table A1: Assumptions
| Parameter (Units) | Value (units) | Source |
| Test Weight hulled barley | 45 lb/A | (USDA-GIPSA 1997) |
| Test Weight naked barley | 58 lb/A | (Canadian Grain Commission 2006) |
| Gasoline | $2.02 / gal | (EIA 2020; API 2020) |
| Diesel | $2.50 / gal | (EIA 2020; API 2020) |
| Carbon dioxide emission diesel | 22.4 lb CO2 / gal | (EIA 2016) |
| Carbon dioxide emission gasoline | 19.6 lb CO2 / gal | (EIA 2016) |
| Carbon dioxide emission electricity | 0.99 lb CO2 / kWh | (EIA 2016) |
*On-road retail price minus Federal, state and local taxes.
Table A2: Field Estimates
| Formula | Source |
| Acres / Hr = mph x machine width x field efficiency) / 8.25 | (Painter 2011) |
| Fuel consumption gal. / hr = hp x 0.044 | (ASAE 2000) |
| Fuel consumption grain hauling = 5 MPG | (Edwards 2017) |
| Dehulling energy use = 7.5 kWh / ton | (Baker 2015) |
Note: Actual values used when reported by the interviewee. Assumptions and estimates used only when the interviewee could not directly provide actual values.
Appendix B: Model Barley Budgets by Region, Season and End Use
Table B1: Northeast/North Central Dryland Winter Feed Barley
| Gross Value of Production | $ / Acre (except where noted) |
| Primary product grain |
|
| (49 bu / A @ $7.88 / bu) | $385 |
| Secondary product silage/straw/grazing |
|
| (2 tons / A @ $110 / ton) | 220 |
| Total, gross value of production | $605 |
| Operating Costs |
|
| Seed | 35 |
| Fertilizerᵃ | 17 |
| Custom services | 7 |
| Fuel, lube, and electricity | 6 |
| Repairs | 25 |
| Straw Baling | 8 |
| Total, operating costs | $98 |
| Allocated Overhead |
|
| Hired labor | 8 |
| Opportunity cost of unpaid labor | 11 |
| Capital recovery of machinery and equipment | 66 |
| Opportunity cost of land | 300 |
| Organic Certification | 8 |
| General farm overheadb | 71 |
| Total, allocated overhead | $464 |
| Costs Listed |
|
| Total, costs listed | $562 |
| Supporting Information |
|
| Value of production less total costs listed | $43 |
| Value of production less operating costs | $507 |
aIncludes compost, manure, and soil amendments
bIncludes insurance, taxes, interest on operating capital, utilities and other allocated overhead not itemized.
Table B2: Northeast/North Central Dryland Spring Food/Malt Barley
| Gross Value of Production | $ / Acre (except where noted) |
| Primary product grain |
|
| (45 bu / A @ $9.67 / bu) | $435 |
| Secondary product silage/straw/grazing |
|
| (2 tons / A @ $110 / ton) | 220 |
| Total, gross value of production | $655 |
| Operating Costs |
|
| Seed | 66 |
| Fertilizerᵃ | 65 |
| Custom services | 1 |
| Fuel, lube, and electricity | 12 |
| Repairs | 36 |
| Straw Baling | 8 |
| Total, operating costs | $188 |
| Allocated Overhead |
|
| Hired labor | 8 |
| Opportunity cost of unpaid labor | 11 |
| Capital recovery of machinery and equipment | 66 |
| Opportunity cost of land | 300 |
| Organic Certification | 8 |
| General farm overheadb | 71 |
| Total, allocated overhead | $464 |
| Costs Listed |
|
| Total, costs listed | $652 |
| Supporting Information |
|
| Value of production less total costs listed | $3 |
| Value of production less operating costs | $467 |
aIncludes compost, manure, and soil amendments
bIncludes insurance, taxes, interest on operating capital, utilities and other allocated overhead not itemized.
Table B3: Western Irrigated Winter Feed Barley
| Gross Value of Production | $ / Acre (except where noted) |
| Primary product grain |
|
| (90 bu / A @ $7.60 / bu) | $684 |
| Total, gross value of production | $684 |
| Operating Costs |
|
| Seed | 40 |
| Fertilizerᵃ | 60 |
| Fuel, lube, and electricity | 8 |
| Repairs | 25 |
| Irrigation | 23 |
| Total, operating costs | $156 |
| Allocated Overhead |
|
| Hired labor | 12 |
| Opportunity cost of unpaid labor | 41 |
| Capital recovery of machinery and equipment | 130 |
| Opportunity cost of land | 215 |
| Organic Certification | 8 |
| General farm overheadb | 122 |
| Total, allocated overhead | $528 |
| Costs Listed |
|
| Total, costs listed | $684 |
| Supporting Information |
|
| Value of production less total costs listed | (-0-) |
| Value of production less operating costs | $528 |
aIncludes compost, manure, and soil amendments
bIncludes insurance, taxes, interest on operating capital, utilities and other allocated overhead not itemized.
Table B4: Western Irrigated Winter Food/Malting Barley
| Gross Value of Production | $ / Acre (except where noted) |
| Primary product grain |
|
| (110 bu / A @ $7.88 / bu) | $867 |
| Total, gross value of production | $867 |
| Operating Costs |
|
| Seed | 40 |
| Fertilizerᵃ | 60 |
| Fuel, lube, and electricity | 34 |
| Repairs | 30 |
| Irrigation | 53 |
| Total, operating costs | $217 |
| Allocated Overhead |
|
| Hired labor | 12 |
| Opportunity cost of unpaid labor | 41 |
| Capital recovery of machinery and equipment | 130 |
| Opportunity cost of land | 215 |
| Organic Certification | 8 |
| General farm overheadb | 122 |
| Total, allocated overhead | $528 |
| Costs Listed |
|
| Total, costs listed | $745 |
| Supporting Information |
|
| Value of production less total costs listed | $122 |
| Value of production less operating costs | $650 |
aIncludes compost, manure, and soil amendments
bIncludes insurance, taxes, interest on operating capital, utilities and other allocated overhead not itemized.
Table C1: Naked vs. Covered Barley Experimental Trial Yield Comparisons 2017—19
| Mean yield (lb/A) | Naked (n=18) | Covered (n=2)* | Difference† | Station-years |
| Oregon Winter | 3,366 | 3,245 | 121 | 2 |
| New York Winter | 2,521 | 2,304 | 217 | 3 |
| Oregon Spring | 3,255 | 3,662 | (407) | 2 |
| New York Spring | 1,840 | 1,363 | 477 | 3 |
| Wisconsin Spring | 1,509 | 1,751 | (242) | 3 |
| *weight of husk removed, estimated at 12% †Naked – Covered weight net of hulls |
| |||
Table C2: Naked vs. Covered Barley Experimental Trial Protein Comparisons 2018—19
| Mean protein (%) | Naked (n=18) | Covered (n=2) | Difference† | Station-years | |
| Oregon Winter | 10.8 | 9.5 | 1.3 | 1 |
|
| New York Winter | 10.2 | 9.3 | 0.9 | 1 |
|
| Oregon Spring | 12.3 | 10.9 | 1.4 | 2 |
|
| New York Spring | 12.9 | 12.2 | 0.7 | 1 |
|
Table D: Naked vs. Covered Barley Economic and Environmental Benefits
|
| Economic Benefit $/ton | GHG Advantage Lb CO2 / ton |
| Dehulling Costs | 42.00 | 7.43 |
| Transportation Costs / mi | 5.44 | 13.44 |
| Crude Protein Value* | 23.40 | 0 |
| Total | $70.84 | 20.87 |
*Values for crude protein were derived from the Beef Cattle Handbook (Torell and Balliette, 1993).