eOrganic authors:
Brittney Goodrich, Auburn University
Joel Cuffey, Auburn University
Kokoasse Kpomblekou-A, Tuskegee University
Alabama lags behind most of the country when it comes to USDA-certified organic farm operations. As a result, Alabama consumers of certified organic products likely have to buy produce and processed products that have been produced outside of the state. This article presents the results of a 2018 survey of fruit, nut, and vegetable producers in Alabama.
- Summary
- Introduction
- USDA Certification Process
- Survey Methods
- Basic Characteristics of Survey Respondents
- Types of Fruits, Nuts, and Vegetables
- Operation Size and Type
- Marketing Channels
- Market Locations
- Other Characteristics
- Certification Challenges
- Production Challenges
- Marketing Challenges
- Economic Viablity of Organic Production
- Future of Organic Production in Alabama
- Suggestions for Increasing Certified-Organic Production in Alabama
- References and Citations
Summary
A total of 36 Alabama producers responded to the survey. Over half of respondents had two or less acres of produce production. The objective of the survey was to learn more about growers' decisions regarding organic certification of produce. We found that the initial cost of certification, the costs of annual inspections required to maintain certification, and the paperwork involved with certification were the largest potential barriers to certification decisions. The most challenging aspects of organic production were perceived to be labor intensity and associated high labor costs, high costs of organic inputs, and difficulty in acquiring organic inputs. The biggest challenges with marketing certified-organic produce were receiving consistent price premiums, obtaining organic price information, and competing with conventional produce.
Nearly 80% of growers surveyed agreed with the statement that using organic practices but not obtaining USDA certification of fruits, nuts, and vegetables is economically viable for their operation. In comparison, only 59% of growers thought certified organic production was economically viable in their operation, so it seems a number of growers think certified organic production is less profitable than not certifying. However, only half of producers who are not certified were aware of USDA's cost-share program for organic certification. Increasing awareness of this program could alleviate some of the concerns with profitability and increase the number of certified organic producers in Alabama. Two-thirds of surveyed certified organic and in-transition producers disagreed with the statement that lenders encouraged organic production in their operations. Another way to incentivize expansion of the certified organic industry in Alabama would therefore be to develop organic education programs with agricultural lenders to facilitate easier credit access to certified organic producers.
Only 13% of conventional producers were not willing to consider organic production in their operation in the future. This suggests that conventional producers may be amenable to certified organic production and therefore contribute to expansion of the industry. Conventional producers often viewed challenges for organic production that did not seem to materialize in the responses from certified organic producers. Increased education and resources regarding organic production practices could alleviate some of these misconceptions and encourage additional conventional producers to consider organic production. These increased educational resources would also benefit current organic producers who signaled a lack of these types of resources.
Introduction
According to the United States Department of Agriculture (USDA), there were 33 certified organic operations in Alabama in 2019, second to last in the number of certified organic operations in the 48 contiguous states (USDA, 2020). In comparison, Georgia and Florida had 301 and 451 certified organic operations, respectively. Alabama lags behind most of the country in certified organic farm operations; consequently, Alabama consumers likely have to buy certified organic produce and processed products that have been produced outside of the state. With a growing desire of consumers to access locally sourced products, it is necessary to identify challenges Alabama producers face when certifying organic, so that efforts might be made to increase certified organic production in the state to meet consumer demands. This report describes results of a 2018 survey of fruit, nut and vegetable producers in Alabama. The objective of the survey was to learn more about growers' decisions regarding the pursuit of organic certification.
The report is structured as follows: first, we explain the USDA certification process. Next, the basic characteristics of the survey respondents are outlined in terms of types of fruits, nuts, and vegetables produced, production practices followed, size of operation, and other characteristics. After the operation characteristics, we describe challenges (both perceived and realized) faced by producers using organic practices. We describe challenges associated with organic certification, production, marketing, and its economic viability. Finally, we provide a discussion on questions related to the future of the certified organic industry in Alabama, and suggestions for increasing certified organic production in the state.
To label any produce with the USDA-certified organic seal (Fig. 1), the farm must obtain certification through a USDA-accredited certifying agent. USDA identifies the certification process as follows:
- The farm or business adopts organic practices, selects a USDA-accredited certifying agent, and submits an application and fees to the certifying agent.
- The certifying agent reviews the application to verify that practices comply with USDA organic regulations.
- An inspector conducts an on-site inspection of the applicant's operation.
- The certifying agent reviews the application and the inspector's report to determine if the applicant complies with the USDA organic regulations.
- The certifying agent issues organic certificate.
To maintain certification, the farm must undergo an annual review and inspection. Before certification is issued, a farm must demonstrate a transition period of three years during which only compliant organic practices are used, and prohibited substances are not applied on the land. In addition, during this transition period, produce from the land must not be labeled or sold as organic, and the USDA organic or certifying agent's seal must not be used. Farms with less than $5,000 per year in organic sales are exempt from organic certification. Although these farms may not use the USDA organic label or label their produce as certified organic, they may identify their produce as organic if they grow their crop in accordance with organic standards. Small farms may voluntarily take all steps to obtain USDA organic certification and then would be allowed to use the USDA organic seal.
For more information, view the USDA National Organic Program (NOP) Handbook:https://www.ams.usda.gov/rules-regulations/organic/handbook. See also the eOrganic article An Introduction to Organic Certification Requirements and the webinar ABCs of Organic Certification.
USDA certifying agents can be located at the following website:https://www.ams.usda.gov/resources/organic-certifying-agents
Figure 1. USDA Organic Seal (https://www.ams.usda.gov/rules-regulations/organic/organic-seal )
The survey was distributed online and in paper format to Alabama farmers. Respondents could have been farmers using either conventional or organic methods. A link to the online Qualtrics survey was distributed through various industry electronic newsletters (examples include Alabama Farmer's Federation and Alabama Fruit and Vegetable Grower's Association [AFVGA]). Additionally, some farmers were emailed a direct link to the survey. Paper surveys were distributed at the 2018 AFVGA Conference in Clanton, Alabama. A total of 36 fruit, vegetable, and/or nut growers in Alabama responded to the survey. Growers were not required to answer every question, so the number of responses varies by question. We provide the number of growers that answered by question in the discussion that follows.
From initial discussions with produce growers in Alabama, we found that some growers told consumers that they followed organic practices but had not obtained USDA certification. Any grower that does not obtain USDA certification or is not exempt (i.e., selling less than $5,000 of organic produce annually) may not legally label their produce as organic. If the grower is not exempt, by stating that produce is grown with organic practices but not certified, the grower may be illegally taking advantage of premiums associated with organic certification without investing the time and money into certification and following organic standards. The consumer of this produce has no way of knowing whether organic standards have been followed. We believe distinguishing certified organic production from the use of organic practices without certification when collecting information regarding producer decisions and challenges illustrates some of the barriers to organic certification. In the following report, we use the terminology “organic practices not-certified” to refer to producers who indicated that they use organic practices without obtaining USDA certification. Legally, these growers cannot label their produce as organic unless they are exempt. It is important to note that we are not promoting this as a marketing strategy, as it undermines confidence in certified organic production.
Survey respondents were asked to indicate the percentage of total sales and acreage of fruit, nut, and vegetable production that fell into the following growing practices: conventional, organic-certified, organic in-transition, organic practices-not certified, certified naturally grown, naturally grown-not certified, and other. Figure 2 and Table 1 below show the types of practices used by the survey respondents. Most survey respondents had a majority of their sales fall under the organic practices–not certified category (39%), while 33% of respondents had most of their sales fall into the conventional category of production. Sixteen percent of growers had production that was either certified-organic or in transition to become certified, and 6% of growers reported certified naturally grown production. Sixty-seven percent of producers who use organic practices but are not certified also stated they had less that $5,000 in gross sales from their farm operation. Producers with less than $5,000 in gross sales from organics are exempt from certification (USDA-NOP). Thus, many of the producers using organic practices but are not certified are exempt from certification. Even with the exemption, producers cannot label their products as certified organic, or use the USDA organic seal. They also cannot sell their product to be used in an organic processed product.
Even though a majority of growers reported using organic practices but not certified, most of the acreage of fruit, nut, and vegetable production fell under conventional practices (77% in Table 1). Growers using organic practices without certification represented 90 acres, or 15% of the total acreage. Four percent of the total acreage was evenly split among certified or in-transition organic acreage (10 acres each). Two percent of acreage was categorized as other production practices.
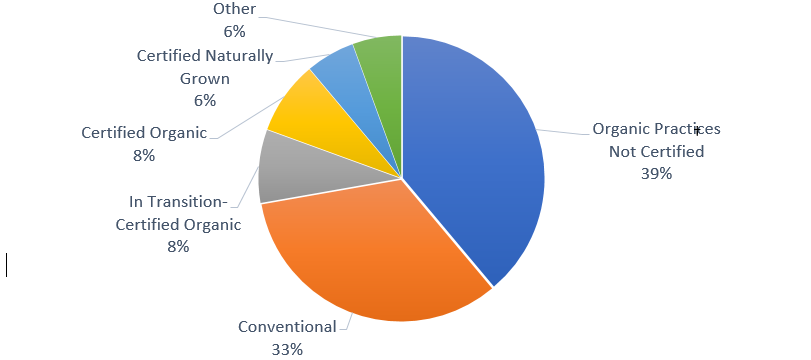
Figure 2. Percentage of Respondents Indicating the Majority of their Sales by Each Growing Practice (N=36)
† Organic practices–not certified: Claim to use organic practices but do not obtain USDA certification. Many of these growers may be exempt from certification. Legally they cannot sell, label, or represent their products as organic.
Table 1. Acreage in Each Growing Practice Category Across All Survey Respondents
| Growing Practice | Acres | Percentage of Total Acreage |
| Conventional | 459 | 77% |
| Organic Practices-Not Certified† | 90 | 15% |
| Organic Practices in Transition | 10 | 2% |
| Organic Practices-Certified | 10 | 2% |
| Certified Naturally Grown | 8 | 1% |
| Other | 12 | 2% |
| Total | 600 |
† Organic practices–not certified: Claim to use organic practices but do not obtain USDA certification. Many of these growers may be exempt from certification. Legally they cannot sell, label, or represent their products as organic.
Types of Fruits, Nuts, and Vegetables
Table 2 displays the percentage of growers who indicated the types of fruit, nuts, and vegetables that were most economically important for their operation. Table 3 displays the same percentage, but for those organically produced (either certified or not-certified). There was quite a bit of crossover between the two lists, where vegetables, tomatoes, squash, grapes/muscadines, collards, and okra were economically important across all types of operations. Lettuce, strawberry, blueberry, and watermelons were less likely to be economically important for producers using organic practices. This suggests that there may be less demand for these crops to be organically produced, or these crops in particular may be more difficult to produce using organic practices.
Table 2. Top 15 Economically Important Fruits, Nuts, and Vegetables (N=35)
| Fruit/Vegetable | Percentage of Growers* |
| Vegetables | 26% |
| Tomatoes | 23% |
| Lettuce | 17% |
| Strawberry | 14% |
| Blueberries | 14% |
| Squash | 11% |
| Collards | 11% |
| Okra | 9% |
| Peppers | 9% |
| Watermelons | 9% |
| Grapes/Muscadines | 9% |
| Fruit | 9% |
| Blackberries | 9% |
| Herbs | 9% |
| Cucumbers | 6% |
Table 3. Top 10 Economically Important Fruits, Nuts, and Vegetables Produced Using Organic Practices (Certified or Not-certified†) (N=20)
| Fruit/Vegetable | Percentage of Growers* |
| Tomatoes | 30% |
| Collards | 30% |
| Peppers | 20% |
| Vegetables | 20% |
| Squash | 15% |
| Okra | 10% |
| Turmeric | 10% |
| Grapes/Muscadines | 10% |
| Cabbage | 10% |
| Onions | 10% |
† Organic practices–not certified: Claim to use organic practices but do not obtain USDA certification. Many of these growers may be exempt from certification. Legally they cannot sell, label, or represent their products as organic.
*Growers listed top three, so percentages sum to over 100%
Operation Size and Type
For the remaining sections, we categorize respondents into three main categories: certified or in-transition organic, conventional, and organic practices-not certified. To maintain confidentiality, any respondents that used naturally grown production practices (either certified or not) were included in the organic practices-not certified category. We also had one respondent that indicated that their operation was USDA Good Agricultural Practices (GAP) certified. This individual was grouped in the conventional category.
Table 4 displays business characteristics across the three categories and for the full sample. Across all three types, the Limited Liability Company or Sole Proprietorship were the most common types of business structure. Producers who use organic practices but are not certified were more likely to consider their farm a full-time business, compared to conventional and certified organic producers. Sixty-seven percent of those producers also stated they had less than $5,000 in gross sales from their farm operation. Producers with less than $5,000 in gross sales are exempt from certification (USDA-NOP). Fifty-two percent of the sample met this criterion.
Table 5 shows that conventional producers tended to operate larger farming operations on average, owning and renting more acreage than the other groups. Conventional operations also had slightly higher numbers of total workers on their farm operations. Producers using organic practices but not certified had the highest average of non-family labor on their operations. Conventional producers on average had more experience farming than the other two groups, while the experience using organic practices on average was around four years for each of the organic groups.
Table 4. Farm Operation Characteristics
| Certified or In-Transition Organic (N=6) | Conventional (N=12) | Organic Practices-Not Certified† (N=15) | All (N=33) | |
| Business Structure of Farm | ||||
| Sole Proprietorship | 33% | 42% | 47% | 42% |
| Limited Liability Company (LLC) | 67% | 25% | 40% | 39% |
| Partnership | 0% | 17% | 0% | 6% |
| Sub Chapter C Corporation | 0% | 8% | 0% | 3% |
| Sub Chapter S Corporation | 0% | 8% | 7% | 6% |
| Cooperative | 0% | 0% | 7% | 3% |
| Farming Operation: Full-time vs Part-Time | ||||
| Full-Time | 50% | 42% | 73% | 58% |
| Part-Time | 50% | 58% | 27% | 42% |
| Gross Sales from Farm Operation in 2017 | ||||
| Less than $5,000 | 50% | 33% | 67% | 52% |
| $5,000-$9,999 | 33% | 25% | 13% | 21% |
| $10,000-$24,999 | 17% | 17% | 7% | 12% |
| $25,000-$49,999 | 0% | 8% | 0% | 3% |
| $50,000-$99,999 | 0% | 8% | 7% | 6% |
| $100,000-$249,999 | 0% | 8% | 7% | 6% |
† Organic practices–not certified: Claim to use organic practices but do not obtain USDA certification. Many of these growers may be exempt from certification. Legally they cannot sell, label, or represent their products as organic.
Table 5. Acreage, Labor, and Experience of Survey Respondents
| Certified or In-Transition Organic (N=6) | Conventional (N=12) | Organic Practices-Not Certified† (N=15) | Total Average | |
| Acres Owned | 19.67 | 105.75 | 27.8 | 54.67 |
| Acres Rented/Leased | 1.5 | 61.5 | 0.2 | 21.52 |
| Total Land | 21.17 | 162.13 | 28 | 75.53 |
| Family members working on farm operation | 1.67 | 2.17 | 1.4 | 1.73 |
| Non-family members working on farm operation | 0.5 | 0.83 | 1.4 | 1.03 |
| Total Workers | 2.17 | 3 | 2.8 | 2.76 |
| Years Farming | 6 | 15.09 | 5.8 | 9.03 |
| Years Using Organic Practices | 4 | 1.36 | 3.8 | 3 |
† Organic practices–not certified: Claim to use organic practices but do not obtain USDA certification. Many of these growers may be exempt from certification. Legally they cannot sell, label, or represent their products as organic.
Table 6 displays the percentage of respondents that use each distribution channels for fruits, nuts, and/or vegetables produced using specific types of production practices. Producers could indicate multiple types of produce marketed, as well as multiple distribution channels, so percentages sum to more than 100%. Table 7 displays the primary distribution channel used for fruits, nuts, and/or vegetables produced using a specific production practice. Again, producers could indicate marketing produce of different types, but only one distribution channel per type was allowed.
For conventional, certified organic, and not-certified produce, the most popular distribution channels are farmers markets and farm-stands (Table 6). Additionally, for certified organic producers, specialty food stores and food cooperatives were another popular distribution channel. For producers using naturally grown production practices, the most popular distribution channels were farmers markets and community supported agriculture (CSA). Respectively, 31% and 40% of producers using organic practice but not certified and naturally grown producers indicated other channels used to market their produce. Text responses indicated that these were often restaurants that were purchasing produce directly from producers.
When looking at what producers considered their primary marketing channel (Table 7) differences arise among the categories of produce sold. Fifty percent of conventional producers considered on-farm marketing to be their primary distribution method, while 30% consider CSA to be their primary marketing method. A majority of certified and producers using organic practices but non-certified use farmers markets as their primary distribution channel (67% of these producers). A third of certified organic producers primarily market their produce using specialty stores/food cooperatives, while 27% of not-certified producers consider on-farm marketing their primary method. Naturally grown producers were evenly distributed with respect to their primary marketing channels over farmers markets, on-farm stands, CSA and other methods of distribution.
Table 6. Percentage of respondents using each distribution channel for marketing fruits, nuts, and/or vegetables of different production practices
| Conventional (N=11) | Certified Organic (N=3) | |
| On-Farm/Farm Stand | 82% | 67% |
| Farmers Market | 91% | 100% |
| Wholesaler/Broker | 36% | 33% |
| Specialty Store/Food Cooperative | 36% | 67% |
| CSA (Community-Supported Agriculture) | 36% | 33% |
| Internet/Mail Order | 27% | 0% |
| Grocery Store | 18% | 33% |
| Processor | 9% | 33% |
| Other | 0% | 0% |
Note: Producers could select more than one distribution channel used, so percentages sum to more than 100%. Producers could also select more than one type of produce marketed.
Table 7. Percentage of respondents by primary distribution channel for marketing fruits, nuts and/or vegetables of different production practices
| Conventional (N=10) | Certified Organic (N=3) | Organic Practices-Not Certified† (N=15) | Naturally Grown (Certified or Not-Certified) (N=4) | |
| Farmers Market | 10% | 67% | 67% | 25% |
| CSA (Community-Supported Agriculture) | 30% | 0% | 0% | 25% |
| On Farm/Farm Stand | 50% | 0% | 27% | 25% |
| Grocery Store | 10% | 0% | 0% | 0% |
| Specialty Store/Food Cooperative | 0% | 33% | 0% | 0% |
| Wholesaler/Broker | 0% | 0% | 0% | 0% |
| Other | 0% | 0% | 7% | 25% |
Note: Producers were only allowed to select one primary marketing channel, so percentages sum to 100%. Producers could select more than one type of produce marketed.
† Organic practices–not certified: Claim to use organic practices but do not obtain USDA certification. Many of these growers may be exempt from certification. Legally they cannot sell, label, or represent their products as organic.
Figure 3 and Figure 4 display maps illustrating where conventionally and organic/naturally produced fruits, nuts, and vegetables are marketed. Similarities arise between the two in that major metropolitan areas are often targeted across both groups (Decatur, Huntsville, Madison, Birmingham and Montgomery). Organic or naturally produced growers do have some markets outside of the state (Knoxville, TN and Meridian, MS).
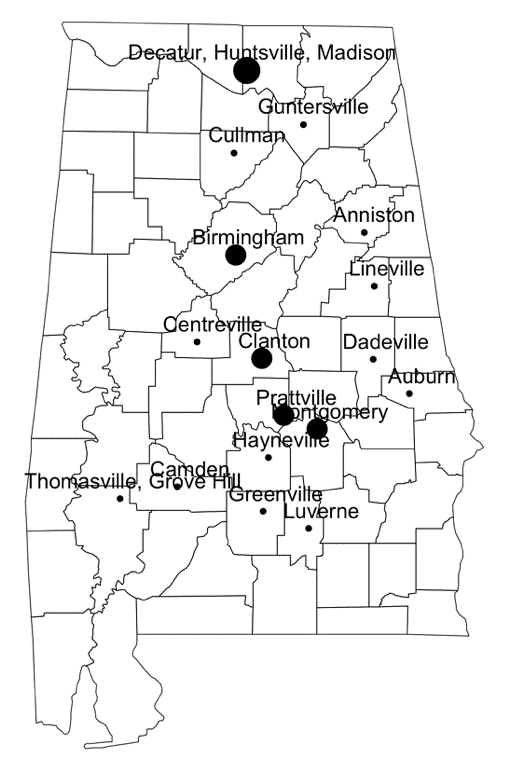
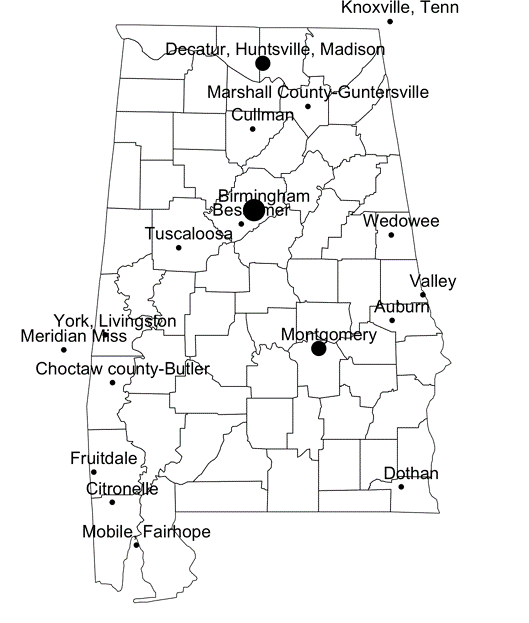
Figure 4. (right) Markets for organic and naturally produced fruits, nuts, and vegetables (certified or not-certified†) (Note: Size of circle indicates number of responses marketing in that area. Map is not drawn to scale.)
† Organic practices–not certified: Claim to use organic practices but do not obtain USDA certification. Many of these growers may be exempt from certification. Legally they cannot sell, label, or represent their products as organic.
Table 8 displays information regarding the respondents' age and technology utilized by the respondent on their operation. The average age across all producers was 51, certified/in-transition organic producers were slightly older on average (59), while conventional producers were slightly younger on average (47). Producers using organic practices but not certified were on average 52 years old.
On average across all producers, respondents had owned a smartphone for 9 years. Certified/in-transition growers had owned a smartphone the longest on average (11 years). Conventional and not-certified producers had owned smartphones on average for 8 and 9 years, respectively.
Producers were asked about the season-extending methods used in their fruit, vegetable, and/or nut operations. On average, producers used two to three different season-extending methods. The most popular was irrigation (81% of respondents). Over half of producers (55%) used high tunnels, while 35% used a low-tunnel system, and 29% used a greenhouse. Nearly half (45%) of producers used plastic mulch. Slightly more certified/in-transition and not-certified growers used high tunnels than did conventional growers. At least half of certified/in-transition and conventional growers used plastic mulch, whereas only 29% of not-certified growers used plastic mulch. Conventional growers and not-certified growers were more likely to be using greenhouses than certified-organic growers.
Table 8. Age, years owning smartphone, and season-extension methods used by respondents
| Certified or In-Transition Organic (N=6) | Conventional (N=11) | Organic Practices-Not Certified† (N=15) | All (N=32) | |
| Age | 59 | 47 | 52 | 51 |
| Years owning smartphone | 11 | 8 | 9 | 9 |
| Season Extending Methods | ||||
| High Tunnel | 67% | 45% | 57% | 55% |
| Irrigation | 83% | 82% | 79% | 81% |
| Plastic mulch | 50% | 64% | 29% | 45% |
| Low tunnel system/Row covers | 33% | 45% | 29% | 35% |
| Greenhouse | 17% | 36% | 29% | 29% |
| Number Season Extending Methods | 2.5 | 2.7 | 2.2 | 2.5 |
†Not Organic practices–not certified: Claim to use organic practices but do not obtain USDA certification. Many of these growers may be exempt from certification. Legally they cannot sell, label, or represent their products as organic.
Table 9 displays respondents' indications regarding potential barriers to obtaining organic certification. Respondents indicated if the potential barrier was severe (2), moderate (1) or not a barrier to organic certification. Of course, the term “barriers” may be interpreted differently across different production practices. For producers using conventional and organic practices but not certified, these barriers might be perceived, as they have not gone through the certification process, or they might be the reason the producers chose not to certify. Certified/in-transition organic growers may be responding from their past experience, representing what they found challenging about the certification process, or they may be responding based on what they perceive to be barriers for other growers. We do not distinguish between different interpretations of the term “barrier” here, though future researchers may consider this when writing survey questions.
On average across the entire sample, the initial cost of certification, the costs of annual inspections associated with maintaining certification, and the paperwork involved with certification were the largest potential barriers to certifying organic. Of least concern were barriers associated with short-term farmland rental agreements not supporting organic transition (likely due to the fact that respondents owned most of their land as displayed in Table 4), interactions with the organic certifier, and a lack of knowledge or information about the certification process.
There were differences in perceived barriers across the three types of producers. For certified or in-transition producers (those having experience with the certification process), the costs of annual inspections for maintaining certification, loss of flexibility with respect to pest and disease treatments, and the lack of certifying agencies nearby presented the most significant barriers. Very few conventional producers perceived the lack of nearby organic certifying agencies as being an issue, suggesting that the experience of the certified/in transition producer is different from the conventional grower's perception. Conventional producers perceived the loss of flexibility with regard to pest and disease treatments, and the three-year transition period, as being substantial challenges. Certified organic/in-transition producers did not find the three-year transition period to be a significant barrier. Producers using organic practices but not certified did not perceive the loss of flexibility with pest and disease treatments to be a large potential barrier. The fact that the certified organic producers found this to be challenging illustrates that production practices under certification may be more restrictive than not-certified producers realize.
Table 9. Potential or Realized Barriers to Obtaining USDA Organic Certification
| Certified or In-Transition Organic (N=6) | Conventional (N=12) | Organic Practices-Not Certified† (N=13) | All (N=31) | |
| Initial cost of certification | 0.83 | 0.67 | 1 | 0.85 |
| Cost of annual inspections/maintaining certification | 1 | 0.63 | 0.91 | 0.84 |
| Loss of flexibility with respect to pest and disease treatments | 1 | 0.82 | 0.27 | 0.63 |
| Loss of flexibility with respect to crop rotations and fertility | 0.67 | 0.7 | 0.3 | 0.54 |
| 3-year organic transition period | 0.17 | 0.8 | 0.56 | 0.56 |
| Paperwork | 0.67 | 0.7 | 0.89 | 0.76 |
| Interaction with organic certifier | 0.6 | 0 | 0.7 | 0.43 |
| Lack of knowledge/information about certification process | 0.33 | 0.5 | 0.6 | 0.5 |
| Lack of nearby organic certifying agencies | 1 | 0.33 | 0.67 | 0.67 |
| Short-term farmland rental agreements do not support organic transition | 0.25 | 0.33 | 0 | 0.21 |
Values: 0-Not a barrier, 1-Moderate barrier, 2-Severe barrier
† Organic practices–not certified: Claim to use organic practices but do not obtain USDA certification. Many of these growers may be exempt from certification. Legally they cannot sell, label, or represent their products as organic.
The major barriers to certification for not-certified producers involved the initial and maintenance costs of certifying, and the paperwork involved. This makes sense given this group had the highest share of gross sales under $5,000, suggesting the group does not have a large amount of operating capital to invest in certification. Because this was such a large perceived barrier to those who would presumably be most likely to certify organic, we also asked if producers were aware of the USDA Cost Share Program. As expected, most of the certified or in-transition producers were aware of the program (83%), whereas only around half of the conventional producers (54%) and not-certified producers (45%) were aware of the cost-share program. Increasing awareness of this program could increase the number of certified organic producers in Alabama.
Table 10. Awareness of USDA National Organic Certification Cost-Share Program
| Certified or In-Transition Organic (N=6) | Conventional (N=13) | Organic Practices-Not Certified† (N=11) | All (N=30) | |
| Are you aware of the USDA's National Organic Certification Cost Share Program which pays for up to 75% of organic certification costs? | 83% | 54% | 45% | 57% |
† Organic practices–not certified: Claim to use organic practices but do not obtain USDA certification. Many of these growers may be exempt from certification. Legally they cannot sell, label, or represent their products as organic.
Table 11 shows respondents' indications of the severity of potential challenges of producing fruits, nuts, and/or vegetables using organic practices. Respondents could indicate whether a potential challenge was severe (2), moderate (1), or not a challenge (0). Across all types of producers, the most challenging aspects of organic production were perceived to be labor intensity and associated high labor costs, high costs of organic inputs (seeds, fertilizer, etc.), and difficulty acquiring organic inputs. The certified or in-transition producers reported more of a challenge with high costs of inputs and difficulty acquiring inputs than the other two groups. Conventional producers perceived that it would be difficult to produce retail-quality organic produce using organic practices. However, organic producers (certified and not-certified) on average thought otherwise. Conventional producers did not perceive labor costs to be as much of a barrier as did the producers using organic practices. Conventional producers did not see the high costs of equipment necessary for organic production, or the lack of resources for assistance with organic production to be much of a challenge at all. However, many of the producers (either organic certified or non-certified) considered these to be a moderate or severe challenge. This suggests that experience with actual organic practices leads to the realization of these challenges. More resources for organic producers in Alabama, such as extension programs, may be helpful in facilitating adoption of organic practices, as well as finding ways to decrease the costs of organic inputs and increase producer access to them.
Table 11. Potential challenges of producing organic (certified or not-certified) fruits, nuts, and vegetables
| Certified or In-Transition Organic (N=6) | Conventional (N=12) | Organic Practices-Not Certified† (N=14) | All (N=32) | |
| Labor intensity/high labor costs | 1.5 | 1.11 | 1.67 | 1.44 |
| High organic input costs (seed, fertilizer, pesticides) | 1.83 | 1.36 | 1.38 | 1.47 |
| Difficulty acquiring organic inputs (seed, fertilizer, pesticides) | 1.67 | 1.22 | 0.92 | 1.19 |
| High costs of equipment necessary for organic production | 1.17 | 0.5 | 1.25 | 1 |
| Lack of knowledge of organic production practices | 0.83 | 0.9 | 0.27 | 0.63 |
| Lack of resources for assistance with organic production (Extension agents, crop advisors, etc.) | 1.17 | 0.33 | 0.92 | 0.79 |
| Difficulty producing retail quality organic produce | 0.5 | 1.5 | 0.6 | 0.88 |
| Low yields | 0.83 | 1.13 | 0.36 | 0.72 |
Values: 0-Not a challenge, 1-Moderate challenge, 2-Severe challenge
† Organic practices–not certified: Claim to use organic practices but do not obtain USDA certification. Many of these growers may be exempt from certification. Legally they cannot sell, label, or represent their products as organic.
Table 12 displays a comparison of how producers regarded various production challenges for organic production versus conventional production. Most producers thought weather challenges were equally or more challenging for organic production than conventional. A larger share of not-certified growers thought organic production brought more challenges than conventional in terms of weather than the other two grower categories. A large share of growers thought organic production is more challenging than conventional in terms of insect (69%), disease (66%) and weed (63%) control. This was similar across all of the categories of growers. 9% of all producers were unsure about the comparison of weed control in conventional vs organic production. Largely this was driven by conventional growers being unsure. In terms of fertility, many producers indicated organic production is more challenging than conventional (44%) and a quarter of producers indicated they were equally as challenging. A fairly large portion of producers (19%) indicated that maintaining fertility was less challenging when using organic practices. This was largely driven by the not-certified producers, while none of the certified or in-transition organic producers thought this was the case. This suggests that the not-certified producers may not be adhering to organic certification standards, and certified organic producers that must follow certification standards may find fertility more challenging.
Table 12. Relative production challenges using organic versus conventional practices
| Certified or In-Transition Organic (N= 6) | Conventional (N=12) | Organic Practices-Not Certified† (N=14) | All (N=32) | |
| Weather | ||||
| Organic less challenging than conventional | 0% | 8% | 14% | 9% |
| Organic equally challenging as conventional | 67% | 58% | 29% | 47% |
| Organic more challenging than conventional | 33% | 25% | 57% | 41% |
| Unsure | 0% | 8% | 0% | 0% |
| Insect Control | ||||
| Organic less challenging than conventional | 0% | 0% | 14% | 6% |
| Organic equally challenging as conventional | 33% | 17% | 14% | 19% |
| Organic more challenging than conventional | 67% | 75% | 64% | 69% |
| Unsure | 0% | 8% | 7% | 6% |
| Disease Control | ||||
| Organic less challenging than conventional | 0% | 0% | 14% | 6% |
| Organic equally challenging as conventional | 17% | 17% | 43% | 28% |
| Organic more challenging than conventional | 83% | 83% | 43% | 66% |
| Unsure | 0% | 0% | 0% | 0% |
| Weed Control | ||||
| Organic less challenging than conventional | 0% | 0% | 7% | 3% |
| Organic equally challenging as conventional | 33% | 33% | 14% | 25% |
| Organic more challenging than conventional | 67% | 50% | 71% | 63% |
| Unsure | 0% | 17% | 7% | 9% |
| Fertility | ||||
| Organic less challenging than conventional | 0% | 8% | 36% | 19% |
| Organic equally challenging as conventional | 50% | 25% | 14% | 25% |
| Organic more challenging than conventional | 50% | 58% | 29% | 44% |
| Unsure | 0% | 8% | 21% | 13% |
† Organic practices–not Certified: Claim to use organic practices but do not obtain USDA certification. Many of these growers may be exempt from certification. Legally they cannot sell, label, or represent their products as organic.
Challenges of Marketing Organic Produce
Table 13 displays average values for producer responses regarding potential challenges associated with marketing certified organic produce. The biggest challenges on average across all producers were perceived to be receiving consistent price premiums, obtaining organic price information, and competition with conventional produce. The severity of these perceived challenges differed across types of producers. Conventional producers indicated the ability to provide visually-appealing organic produce would be a significant challenge, whereas certified and not-certified growers were less concerned with this. The top concern of certified organic producers was competition with conventional produce, while the top concern for not-certified producers was receiving consistent price premiums. The difference in opinions across conventional and organic producers suggests that increased education about organic practices could decrease perceived barriers to enrollment for conventional producers.
Table 13. Potential challenges of marketing certified organic fruits, nuts, and vegetables
| Certified or In-Transition Organic (N=6) | Conventional (N=12) | Organic Practices-Not Certified† (N=13) | All (N=31) | |
| Finding enough buyers to sell all produce | 0.5 | 0.67 | 0.67 | 0.63 |
| Finding reliable buyers | 0.67 | 0.75 | 0.62 | 0.68 |
| Providing visually-appealing organic produce | 0.5 | 1 | 0.25 | 0.56 |
| Obtaining organic price information | 0.67 | 0.8 | 0.7 | 0.73 |
| Receiving consistent price premiums | 0.67 | 1 | 0.8 | 0.85 |
| Distance to markets/customers | 0.5 | 0.55 | 0.62 | 0.57 |
| Competition with conventionally-grown produce | 0.83 | 0.8 | 0.58 | 0.71 |
| Competition with non-certified produce | 0.67 | 0.6 | 0.45 | 0.56 |
Values: 0-Not a challenge, 1-Moderate challenge, 2-Severe challenge
†Organic practices–not certified: Claim to use organic practices but do not obtain USDA certification. Many of these growers may be exempt from certification. Legally they cannot sell, label, or represent their products as organic.
Table 14 displays producers' level of agreement to the statement “Organic labels on fruits, nuts, and vegetables provide a price premium over conventional labels.” Most producers agreed with this statement, either strongly (38%) or somewhat (31%). Sixteen percent of growers were unsure about the statement, and 16% disagreed with the statement. The level of agreement varied across producer types. All certified/in-transition organic growers agreed with the statement, while nearly 80% of the not-certified growers agreed with the statement. On the other hand, only 41% of conventional producers agreed that organic labels result in premiums, while a third disagreed with the statement. Twenty-five percent of conventional producers were unsure of the premium relationship. Recall that conventional producers perceive production of visually-appealing organic produce as a large challenge. It is possible that conventional growers think the lack of visual appeal of organic produce overcomes the organic premium.
Table 14. Producers' level of agreement with the following statement: Organic labels on fruits, nuts, and vegetables provide a price premium over conventional labels
| Certified or In-Transition Organic (N=6) | Conventional (N=12) | Organic Practices-Not Certified† (N=14) | All (N=32) | |
| Strongly Agree | 67% | 8% | 50% | 38% |
| Somewhat Agree | 33% | 33% | 29% | 31% |
| Unsure | 0% | 25% | 14% | 16% |
| Somewhat Disagree | 0% | 25% | 7% | 13% |
| Strongly Disagree | 0% | 8% | 0% | 3% |
† Organic practices–not certified: Claim to use organic practices but do not obtain USDA certification. Many of these growers may be exempt from certification. Legally they cannot sell, label, or represent their products as organic.
Nearly 60% of growers agreed with the statement that certified organic production of fruits, nuts, and vegetables was economically viable for their operation, while 30% of producers disagreed with this statement (Table 15). Eleven percent were unsure. These values differed substantially based on the type of producer. One-hundred percent and 69% of certified/in-transition and not-certified growers, respectively, agreed with the statement that certified organic production is economically viable. Only 22% of conventional producers agreed with this statement. The majority of conventional growers (55%) disagreed with the statement that certified organic production was economically viable in their operation, while 22% were unsure. Twenty-three percent of not-certified producers were in disagreement with the statement, while 8% were unsure.
Nearly 80% of growers agreed with the statement that not-certified production of fruits, nuts, and vegetables was economically viable for their operation. Comparing this to the nearly 60% of growers who thought certified organic production was economically viable in their operation, it seems a number of growers think certified organic is less profitable than not-certified. Only 25% of conventional growers disagreed with the statement that not-certified production was economically viable, compared with the 55% who disagreed that certified organic production was economically viable. This suggests that these producers believe certification costs to be economically prohibitive.
Half of producers agreed with the statement that certified organic production was more profitable than conventional production, while 30% disagreed with the statement. Twenty percent of producers were unsure. Over half of the producers (57%) agreed with the statement that not-certified production is more profitable than conventional production, while 29% disagreed with the statement. Sixteen percent were unsure. This again suggests many producers believe certification costs to be economically prohibitive. Interestingly enough, 35% of not-certified producers were unsure or disagreed with the statement that not-certified production is more profitable than conventional production. This suggests that these producers are motivated to use not-certified production practices for a reason other than profitability.
Producers were also asked about how agricultural lenders viewed organic practices. Most producers (54%) were unsure whether using organic practices would increase their access to credit. Thirty-six percent disagreed with the statement. Most producers (57%) were unsure whether their lenders encouraged organic production in their operation, while 30% disagreed with the statement that their lenders encouraged organic production.
Noteworthy findings of Table 15 were that 75% of certified or in-transition producers disagreed with the statement that the use of organic practices increased their access to credit. Sixty-seven percent disagreed with the statement that lenders encouraged organic production in their operations. This suggests lenders of these certified or in-transition growers are not supportive of the growers' choice to produce organically. One reason for this lack of lender support could be that Alabama lenders do not have experience with organic producers. Given the large costs of certifying organic, the organic industry in Alabama may be supported by educating lenders about the certification process and developing programs with lenders that might provide easier credit access.
Table 15. Producers' level of agreement with statements regarding economic viability
| Certified or In-Transition Organic (N=6) | Conventional (N=12) | Organic Practices-Not Certified† (N=14) | All (N=32) | |
| Certified organic production of fruits, nuts, and vegetables is economically viable for my operation. | ||||
| Agree | 100% | 22% | 69% | 59% |
| Unsure | 0% | 22% | 8% | 11% |
| Disagree | 0% | 55% | 23% | 30% |
| Non-certified production of fruits, nuts, and vegetables is economically viable for my operation. | ||||
| Agree | 84% | 67% | 85% | 78% |
| Unsure | 0% | 8% | 15% | 10% |
| Disagree | 17% | 25% | 0% | 13% |
| Certified organic production of fruits, nuts, and vegetables is more profitable than conventional production. | ||||
| Agree | 100% | 25% | 54% | 50% |
| Unsure | 0% | 33% | 15% | 20% |
| Disagree | 0% | 42% | 31% | 30% |
| Non-certified production of fruits, nuts, and vegetables is more profitable than conventional production. | ||||
| Agree | 50% | 50% | 64% | 57% |
| Unsure | 17% | 25% | 7% | 16% |
| Disagree | 34% | 25% | 28% | 29% |
| Using organic practices increases my access to credit. | ||||
| Agree | 25% | 0% | 14% | 11% |
| Unsure | 0% | 50% | 71% | 54% |
| Disagree | 75% | 50% | 14% | 36% |
| My lenders encourage organic production in my operation. | ||||
| Agree | 33% | 11% | 9% | 13% |
| Unsure | 0% | 56% | 73% | 57% |
| Disagree | 67% | 33% | 18% | 30% |
† Organic practices–not certified: Claim to use organic practices but do not obtain USDA certification. Many of these growers may be exempt from certification. Legally they cannot sell, label, or represent their products as organic.
Table 16 shows responses to questions regarding incorporating and/or expanding organic practices on their operation. Most producers indicated that they use organic practices on their operation already (64%); these could be certified organic or not-certified operations. A small number of growers had considered (3%) or tried (3%) organic production on their operation, but ultimately determined it would not work for them. Eleven percent of producers had thought about organic production before, but are still deciding whether it will work in their operation, while another 11% had not considered organic production before.
Growers with only conventional production were asked if they would consider organic production on their operation in the future. Only 13% of those producers were not willing to consider it, while nearly half would consider incorporating organic production. This suggests that conventional producers may be amenable to organic production, and that this may be an area of expansion for the industry.
Producers who indicated that they used organic practices already (either certified or not-certified) were asked about their organic production in the next three years. Over half (52%) said they would be expanding organic production in their operations, while 29% said no changes would occur. Approximately 19% of producers were unsure, and no producers said they would be decreasing their organic production. This indicates that acreage under organic production in Alabama may increase, thus leading to an increase in the organic industry.
Table 17 displays producers' perceptions regarding the popularity of organic production in Alabama. The largest portion of producers (34%) strongly agreed that organic production is growing in popularity in Alabama, but this differed by type of producer. The largest portion of certified/in-transition growers and not-certified growers strongly agreed with this statement. The largest portion of conventional producers somewhat agreed with this statement. Over half of all producers agreed with the statement that organic production is growing in popularity, while 25% were unsure. Only 12% of all growers disagreed with the statement.
Table 16. Producer thoughts about incorporating organic production of fruits, nuts and/or vegetables
| In the past have you thought about incorporating organic production of fruits, nuts and/or vegetables into your operation? | All (N=36) |
| Yes, I have tried organic production, but decided it was not working in my operation. | 3% |
| Yes, I have thought about organic production, but determined it was not going to work in my operation. | 3% |
| Yes, I currently use organic practices (either certified or uncertified) | 64% |
| Yes, I have thought about organic production, but am still undecided about whether it's right for my operation. | 11% |
| No, I have not previously thought about organic production in my operation. | 11% |
| Other | 8% |
| In the future, will you consider incorporating organic production of fruits, nuts and vegetables into your operation? | Conventional Producers Only (N=15) |
| Yes | 47% |
| Maybe | 40% |
| No | 13% |
| How do you see the organic production in your operation changing in the next three years? | Organic Producers Only (Certified, In-Transition and Not-Certified†) (N=21) |
| Increasing organic production | 52% |
| No change in organic production | 29% |
| Decreasing organic production | 0% |
| Unsure | 19% |
Table 17. Producer thoughts about popularity of organic production in Alabama
| Certified or In-Transition Organic (N=6) | Conventional (N=12) | Organic Practices-Not Certified† (N=14) | All (N=32) | |
| Organic production is growing in popularity among Alabama farmers. | ||||
| Strongly Agree | 50% | 17% | 43% | 34% |
| Somewhat Agree | 17% | 42% | 21% | 28% |
| Unsure | 17% | 33% | 21% | 25% |
| Somewhat Disagree | 17% | 8% | 7% | 9% |
| Strongly Disagree | 0% | 0% | 7% | 3% |
† Organic practices–not certified: Claim to use organic practices but do not obtain USDA certification. Many of these growers may be exempt from certification. Legally they cannot sell, label, or represent their products as organic.
Table 18 displays respondents' agreement with various statements. Eighty-three percent of producers were happy with their current farming practices, while the other 17% disagreed with the statement. The responses tended to be distributed similarly across the three types of producers.
Most growers (75%) agreed with the statement that organic practices are better for the environment compared with conventional practices. However, this figure varied substantially across the three categories. All organic producers (certified/in-transition) and not-certified growers agreed with the statement, while only a third of conventional growers agreed. One-third of conventional growers were unsure about the statement, while the other third disagreed with the statement that organic practices are better for the environment than conventional. Similar results hold for the statement that organic production is safer for consumers than conventional production. All organic producers agreed with the statement, while roughly a third of conventional growers agreed, were unsure, or disagreed with the statement. Regarding the statement, “My family prefers to consume organically-produced fruit, nuts, and vegetables,” again, all organic producers agreed with this statement. Forty-two percent of conventional producers agreed with the statement, 25% were unsure, and 33% disagreed with the statement. From these three questions, it is very clear that there are differences in perspectives among types of producers regarding the safety and environmental consequences of conventional versus organic production practices.
Table 18. Producers' level of agreement with various statements
| Certified or In-Transition Organic (N=6) | Conventional (N=12) | Organic Practices-Not Certified† (N=14) | All (N=32) | |
| I am satisfied with my current farming practices. | ||||
| Strongly Agree | 17% | 33% | 36% | 31% |
| Somewhat Agree | 67% | 56% | 43% | 52% |
| Unsure | 0% | 0% | 0% | 0% |
| Somewhat Disagree | 17% | 11% | 21% | 17% |
| Strongly Disagree | 0% | 0% | 0% | 0% |
| Organic practices are better for the environment than conventional practices. | ||||
| Strongly Agree | 100% | 17% | 92% | 65% |
| Somewhat Agree | 0% | 17% | 8% | 10% |
| Unsure | 0% | 33% | 0% | 13% |
| Somewhat Disagree | 0% | 17% | 0% | 6% |
| Strongly Disagree | 0% | 17% | 0% | 6% |
| Organic production of fruits, nuts, and vegetables is safer for consumers than conventional production. | ||||
| Strongly Agree | 100% | 9% | 93% | 65% |
| Somewhat Agree | 0% | 27% | 7% | 13% |
| Unsure | 0% | 27% | 0% | 10% |
| Somewhat Disagree | 0% | 18% | 0% | 6% |
| Strongly Disagree | 0% | 18% | 0% | 6% |
| My family prefers to consume organically produced fruits, nuts, and vegetables. | ||||
| Strongly Agree | 100% | 25% | 100% | 71% |
| Somewhat Agree | 0% | 17% | 0% | 6% |
| Unsure | 0% | 25% | 0% | 10% |
| Somewhat Disagree | 0% | 8% | 0% | 3% |
| Strongly Disagree | 0% | 25% | 0% | 10% |
† Organic practices–not certified: Claim to use organic practices but do not obtain USDA certification. Many of these growers may be exempt from certification. Legally they cannot sell, label, or represent their products as organic.
Many growers raised concerns with certification costs, input costs, and issues related to profitability when comparing organic production with not-certified or conventional production. Additionally, many not-certified producers and conventional producers were unaware of USDA's cost-share program for organic certification. Increasing awareness of this program could alleviate some of the concerns with profitability and increase the number of certified organic producers in Alabama. Given the large costs of organic certification, another way to incentivize expansion of the organic industry in Alabama is to develop programs with agricultural lenders that might provide easier credit access.
Only 13% of conventional producers were not willing to consider organic production in their operation in the future. This suggests that conventional producers may be amenable to organic production, suggesting an area of expansion for the industry. Conventional producers often viewed challenges for organic production that did not seem to materialize in the responses from certified organic producers. Increased education and resources regarding organic production practices could alleviate some of these misconceptions and bring additional conventional producers into organic production.
Over half of organic producers (52%) said they would be expanding organic production in their operations, so increased resources and education would also be helpful to current organic producers looking to expand. Certified organic and not-certified producers indicated a lack of resources regarding organic production. All but two producers indicated that they owned a smartphone, so outreach programs targeting this technology could be of use to these producers.
- Riddle, J. ABCs of Organic Certification. eOrganic webinar. Available at https://eorganic.org/node/4876
- Riddle, J. An Introduction to Organic Certification Requirements. eOrganic article. Available at https://eorganic.org/node/1257
- USDA National Organic Program (NOP) Handbook https://www.ams.usda.gov/rules-regulations/organic/handbook
- USDA Organic Integrity Database. By US State or Territory. April 2020 https://organic.ams.usda.gov/Integrity/Reports/Reports.aspx
Funding for this study was provided by NIFA OREI grant number 2016-51300-26725: