eOrganic author:
Michelle Wander, University of Illinois
Introduction
This article focuses on nutrient budgets (also called element budgets or mass balances) that are commonly used to evaluate the effects of nutrient management on farm and field sustainability. Nutrient budgets are the outcome of a simple accounting process that tracks inputs and outputs to a given, defined system over a fixed period of time. Like a bank account, the budget tracks inputs (credits) to the system and exports (debits) from the system in order to evaluate changes in nutrient stocks of the system. Accelerated rates of nutrient loss are evidence of soil depletion and are unsustainable over the long term and not consistent with organic goals. Accumulation of high levels of nutrients, particularly of P and N, are also undesirable, and are associated with increased pollutant export in the form of leachate or runoff (P and K), or in gaseous form through denitrification or volatilization (N). Nutrient budgeting is most commonly done for the macronutrients—nitrogen (N), phosphorus (P), and potassium (K)—but can be done for other nutrients as well, such as calcium (Ca), magnesium (Mg), or zinc (Zn).
Nutrient budgeting makes sense for organic farms because the organic standards emphasize the use of renewable resources in production and processing as a way to avoid pollution and waste. Nutrient budgeting methods evaluate inputs and outputs as a way to assess efficiency and improve resource allocation. Achieving a balance between inputs and outputs is particularly desirable where external resources are costly and/or non-renewable. Evaluations of resource use efficiency are influenced by the spatial and temporal scale considered. A single year budget for a field might be most useful to a farmer deciding whether or not to apply supplemental nitrogen to a plot before planting a N demanding crop. Multi-year assessments, for example, are more appropriate for field scale budgeting in systems that apply fertilizer or compost one in three or four years. Field scale assessments help managers identify movement of nutrients within farms while whole farm assessments permit comparisons between farming strategies.
- Budgeting Methods Vary in Scope and Complexity
- Budget for Specifics: Dairy Examples
- Simple Budget Example for Harvested Nutrients: Diversified Vegetable Farm
- References and Citations
- Additional Resources
Budgeting Methods Vary in Scope and Complexity
Budgets or mass balance techniques can be used in a variety of ways. Nutrient budgets can help managers evaluate the flows of resources into, out of, and within a farm or management unit. This information can also help farmers protect adjacent resources that could be harmed by unwanted nutrient export. Nutrient budgets are increasingly being used at the policy level and they are being combined with other techniques that evaluate efficiency in terms of energy use or green house gas emissions. Analysis of “efficiency” can be a tricky business. Many, but not all organic farming systems, rely on recycled nutrients produced on farm and, as a result, they frequently have lower nutrient inputs than their conventional counterparts. Reduced nutrient inputs can reduce unwanted exports of leached (N and P) or denitrified (N) nutrients but can also reduce exports in the form of harvested crops. Budgeting techniques are not standardized and so comparison among studies can be difficult. Some evaluate efficiency based on yield and not area managed and this influences the result. Make sure you know what is and what is not being accounted for and how the basic calculations are made and reported.
There are three different types of mass balances or budgeting techniques that are commonly used (Fig. 1): 1) farm gate or whole-farm budgets, 2) field or surface budgets, and 3) farming systems-level budgets.
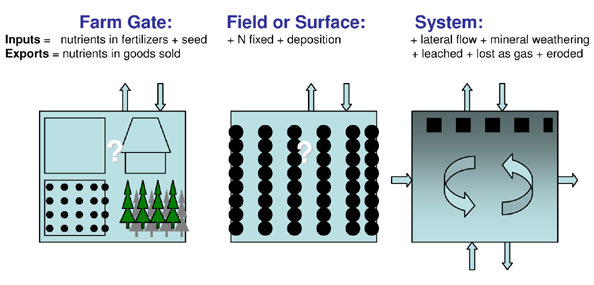
Figure 1. Three types of budgets are commonly used to evaluate nutrient management on farm or field sustainability; differences in underlying assumptions and calculations influence the results. Figure credit: adapted from Cherry et al. (2008).
Farm gate balances account for external flows to and from the farm including purchased fertilizers, feed, and sold animal and crop products. These whole-farm assessments can miss depletion caused by movement of nutrients within the farm. Internal flows of nutrients can be substantial, with deficits in some areas accompanied by stockpiling in other areas. Field-scale estimates capture this reallocation within the farm as they consider inputs of mineral fertilizer and animal manure as the main flows. Some field-scale analysis and most system-level analyses consider inputs from atmospheric deposition and outputs from crop harvest, surface run-off, and leaching. In a surface (field-scale) balance, users do not distinguish between internal and external sources and sinks. System balances include more detailed information about nutrient sources and fates, and often measure or estimate loss from denitrification, volatilization, and lateral transport. System-level analyses require much more information about the sites being considered, but they are quite useful if they are representative of the system because they can identify mechanisms or parts of the system that might be improved by management.
| Farm Gate Budget | Field Budget | System Budget | |
|---|---|---|---|
| Level of detail | Low | Medium | High |
| Difficulty | Low: relies on readily available data, assumptions | Moderate: requires analysis or assumptions, more records | High: requires analysis and simulation of processes |
| Limitations | Fluxes (leaching, deposition) are not accounted for. | Not able to distinguish between internal and external sources; relies on estimates and assumptions (leaching, N fixation, nutrient content of manures and crops). | Quality and availability of data is critical; use of models and assumptions is common; sources of uncertainty same as field budget plus that for denitrification, volatilization, methane emissions, weathering, and so forth. |
| Utility | Useful for farm budgeting, cost accounting | Helps users manage flows within the farm; prevent localized problems of depletion or surplus. | Can identify processes where problems occur; follow the fate of different nutrient sources. |
Budget for Specifics: Dairy Examples
Organic farms are frequently characterized as low external input systems. European research, for example, has reported that N surplus (N output/N inputs) for organic dairy farms is often one-half to one-third that of conventional counterparts. There is a trend among organic dairy farmers, here and abroad, to increase cow performance by purchasing concentrates and succulent feed. Haas et al. (2007) evaluated the impact of imports in German organic farms using farm gate nutrient balances for 26 dairy farms and found that the amount of feed supplied as concentrates or imported to the farm was a very good predictor of N surplus. The increase of N surplus with increasing use of imported concentrates, of course, is environmentally undesirable and inconsistent with organic principles.
Care must be taken to consider all nutrients, not just nitrogen. Strict adherence to a ‘self sufficiency’ approach where no nutrients are imported to farms can deplete both P and K and thus compromise long-term sustainability. Working in Ontario, Canada, Roberts et al. (2008) found that four dairy farms that produced the majority of their feed on-farm had negative average farm P balances. Budgets and soil tests can help farmers make judicious use of feed imports to keep their systems in balance.
Phosphorus and potassium need to be managed separately. Phosphorus accumulation is a common problem where manures or notable quantities of rock phosphate are imported. Manures differ in their tendency to cause problems. A comparison of four organic dairy farms in Pennsylvania representing organic grass, organic crop, conventional crop with grazing, and conventional confinement production found that farm level accumulation of soil P and K may be a concern on organic farms that use poultry manure as a primary crop nutrient source (Rotz et al., 2007). Organic cash grain–based systems without P fertilizer imports can cause large P deficits if care is not taken to manage P reserves. The same is true for potassium.
Potassium management deserves particular attention on sandy soils that have a low capacity to retain or supply nutrients through mineral weathering. Andrist-Rangel et al. (2007) used field-scale budgets in southern Sweden to determine that both organic and conventional farming systems were depleting soil K reserves in loamy soils, and found that reductions were influencing pasture herbage quality by reducing forage K contents.
Simple Budget Example for Harvested Nutrients: Diversified Vegetable Farm
Nutrient budgeting for fields can be helpful for diversified vegetable farms that grow multiple crops in a small area. The tables below show average nutrient concentrations for harvested vegetables and estimates of nutrients removed per acre when planted to a single crop (Table 2) or for a mixture of crops (Table 3).
| Crops | Nutrient content of crop | Yield | lbs nutrient removed per acre by crop | ||||
|---|---|---|---|---|---|---|---|
| N (%) | P (%) | K (%) | lbs per acre | N | P | K | |
| A | B | C | D | E1 | F2 | G3 | H4 |
| tomato | 0.054 | 0.023 | 0.204 | 26300 | 14.202 | 6.049 | 53.652 |
| squash | 0.09 | 0.025 | 0.32 | 30000 | 27 | 7.5 | 96 |
| lettuce | 0.084 | 0.028 | 0.25 | 24000 | 20.16 | 6.72 | 60 |
| pepper | 0.054 | 0.022 | 0.195 | 22300 | 12.042 | 4.906 | 43.485 |
| mustards | 0.162 | 0.043 | 0.354 | 24000 | 38.88 | 10.32 | 84.96 |
| garlic | 0.384 | 0.153 | 0.401 | 16500 | 63.36 | 25.245 | 66.165 |
| eggplant | 0.066 | 0.028 | 0.314 | 22700 | 14.982 | 6.356 | 71.278 |
| broccoli | 0.18 | 0.066 | 0.325 | 11200 | 20.16 | 7.392 | 36.4 |
| cabbage | 0.12 | 0.042 | 0.23 | 32500 | 39 | 13.65 | 74.75 |
| brussel sprout | 0.204 | 0.069 | 0.389 | 17000 | 34.68 | 11.73 | 66.13 |
| carrot | 0.06 | 0.044 | 0.323 | 28500 | 17.1 | 12.54 | 92.055 |
| onion | 0.072 | 0.029 | 0.155 | 38900 | 28.008 | 11.281 | 60.295 |
| greens | 0.09 | 0.042 | 0.296 | 24000 | 21.6 | 10.08 | 71.04 |
| spinach | 0.174 | 0.049 | 0.558 | 11900 | 20.706 | 5.831 | 66.402 |
2 F = B/100*E
3 G = C/100*E
4 H = D/100*E
| Crops | Nutrient content of crop | Yield | Proportion of area | nutrient removed by crop | ||||
|---|---|---|---|---|---|---|---|---|
| N (%) | P (%) | K (%) | (lbs/acre) | N (lbs/acre) | P (lbs/acre) | K (lbs/acre) | ||
| A | B | C | D | E | F1 | G2 | H3 | I4 |
| tomato | 0.054 | 0.023 | 0.204 | 26300 | 0.286 | 4.06 | 1.73 | 15.33 |
| squash | 0.090 | 0.025 | 0.320 | 30000 | 0.143 | 3.86 | 1.07 | 13.71 |
| lettuce | 0.084 | 0.028 | 0.250 | 24000 | 0.143 | 2.88 | 0.96 | 8.57 |
| pepper | 0.054 | 0.022 | 0.195 | 22300 | 0.143 | 1.72 | 0.70 | 6.21 |
| mustards | 0.162 | 0.043 | 0.354 | 24000 | 0.036 | 1.39 | 0.37 | 3.03 |
| garlic | 0.384 | 0.153 | 0.401 | 16500 | 0.018 | 1.13 | 0.45 | 1.18 |
| eggplant | 0.066 | 0.028 | 0.314 | 22700 | 0.071 | 1.07 | 0.45 | 5.09 |
| broccoli | 0.180 | 0.066 | 0.325 | 11200 | 0.036 | 0.72 | 0.26 | 1.30 |
| cabbage | 0.120 | 0.042 | 0.230 | 32500 | 0.018 | 0.70 | 0.24 | 1.33 |
| brussel sprout | 0.204 | 0.069 | 0.389 | 17000 | 0.018 | 0.62 | 0.21 | 1.18 |
| carrot | 0.060 | 0.044 | 0.323 | 28500 | 0.036 | 0.61 | 0.45 | 3.29 |
| onion | 0.072 | 0.029 | 0.155 | 38900 | 0.018 | 0.50 | 0.20 | 1.08 |
| greens | 0.090 | 0.042 | 0.296 | 24000 | 0.018 | 0.39 | 0.18 | 1.27 |
| spinach | 0.174 | 0.049 | 0.558 | 11900 | 0.018 | 0.37 | 0.10 | 1.19 |
| Mean removal per acre | 20.01 | 7.38 | 63.77 | |||||
2 G = B/100 X E x F
3 H = C/100 X E x F
4 I = D/100 X E x F
Field scale budgeting is recommended for N, P, and K. Simple budgets can pick up deficiencies before you see them in soil tests. Soil tests can pick up surpluses associated with manure or compost additions quickly. A combination of testing and budgeting is recommended.
Soil Testing Tips
Take soil tests at a consistent point in your rotation. Soil nutrient and organic matter stocks naturally fluctuate within a rotation so it is a good idea to sample at the point where stocks are at their highest (ideally before the most nutrient demanding crop is grown) or at their lowest point (possibly after crops are seeded and soils are prepared for cover or hay seeding). Soil samples need to be taken from a consistent soil depth, and the depth and timing of sampling should be logically related to your tillage practices. Deeper tillage can lower the average concentration of nutrients and organic matter in surface soils and look like declining fertility, so you might consider using a deep sampling regime (1 foot instead of 6 inches) to reduce this problem. You may want to time sampling and testing so that you have your results in hand before you need to apply fertilizers. Of course, if you are using a budgeting approach you will already have a good idea about what you might need to apply. More likely, your test results will reveal the presence of stocks you might not have assumed where there. Over-application of manures and composts is a concern for many organic growers, particularly those engaged in livestock operations or compost-based intensive vegetable production.
References and Citations
- Andrist-Rangel, Y., A. C. Edwards, S. Hillier, and I. Oborn. 2007. Long-term K dynamics in organic and conventional mixed cropping systems as related to management and soil properties. Agriculture, Ecosystems & Environment 122: 413–426. (Available online at: http://dx.doi.org/10.1016/j.agee.2007.02.007) (verified 11 March 2010).
- Cherry, K. A., M. Shepherd, P.J.A. Withers, and S. J. Mooney. 2008. Assessing the effectiveness of actions to mitigate nutrient loss from agriculture: A review of methods. The Science of the Total Environment 406: 1–23. (Available online at: http://dx.doi.org/10.1016/j.scitotenv.2008.07.015) (verified 11 March 2010).
- Haas, G., C. Deittert, and U. Köpke. 2007. Farm-gate nutrient balance assessment of organic dairy farms at different intensity levels in Germany. Renewable Agriculture and Food Systems 22: 223–232. (Available online at: http://dx.doi.org/10.1017/S1742170507001780) (verified 11 March 2010).
- Maynard, D. N., and G. J. Hochmuth. 2007. Knott's handbook for vegetable growers. 5th ed. John Wiley & Sons, Hoboken, NJ.
- Roberts, C. J., D. H. Lynch, R. P. Voroney, R. C. Martin, and S. D. Juurlink. 2008. Nutrient budgets of Ontario organic dairy farms. Canadian Journal of Soil Science 88: 107–114. (Available online at: http://pubs.aic.ca/doi/abs/10.4141/S06-056) (verified 10 March 2010).
- Rotz, C. A., G. H. Kamphuis, H. D. Karsten, and R. D. Weaver. 2007. Organic dairy production systems in Pennsylvania: A case study evaluation. Journal of Dairy Science 90: 3961–3979. (Available online at: http://dx.doi.org/10.3168/jds.2006-527) (verified 11 March 2010).
Additional Resources
- Aronsson, H., G. Torstensson, and L. Bergstrom. 2007. Leaching and crop uptake of N, P and K from organic and conventional cropping systems on a clay soil. Soil Use and Management 23: 71–81. (Available online at: http://dx.doi.org/10.1111/j.1475-2743.2006.00067.x) (verified 11 March 2010).
- Berry, P. M., E. A. Stockdale, R. Sylvester-Bradley, L. Philipps, K. A. Smith, E. I. Lord, C. A. Watson, and S. Fortune. 2003. N, P and K budgets for crop rotations on nine organic farms in the UK. Soil Use and Management 19: 112–118. (Available online at: http://doi.wiley.com/10.1111/j.1475-2743.2003.tb00289.x ) (verified 11 March 2010).
- Drinkwater, L. 2005. On-farm nutrient budgets in organic cropping systems: A tool for soil fertility management. Project report summary. Project number 40844. Organic Farming Research Foundation, Santa Cruz, CA.
- Gosling, P., and M. Shepherd. 2005. Long-term changes in soil fertility in organic arable farming systems in England, with particular reference to phosphorus and potassium. Agriculture, Ecosystems & Environment 105: 425–432. (Available online at: http://dx.doi.org/10.1016/j.agee.2004.03.007) (verified 11 March 2010).
- National Research Council, Committee on Long Range Soil and Water Conservation. 1993. Nitrogen and phosphorus mass balances: methods and interpretation. p. 431–477. In Committee on Long Range Soil and Water Conservation (ed.) Soil and water quality: An agenda for agriculture. National Academy Press, Washington DC.
- Topp, C.F.E., E. A. Stockdale, C. A. Watson, and R. M. Rees. 2007. Estimating resource use efficiencies in organic agriculture: A review of budgeting approaches used. Journal of the Science of Food and Agriculture 87: 2782–2790. (Available online at: http://dx.doi.org/10.1002/jsfa.3059) (verified 11 March 2010).